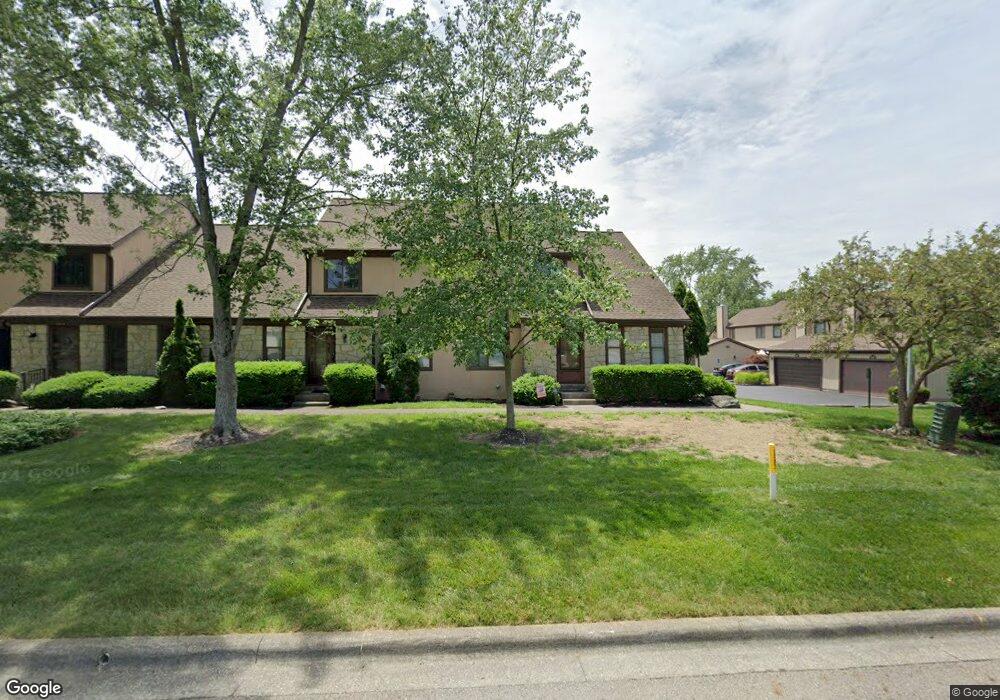
6317 Sabastian Ct Columbus, OH 43213
Olde Orchard NeighborhoodEstimated Value: $212,000 - $232,000
3
Beds
3
Baths
1,687
Sq Ft
$134/Sq Ft
Est. Value
About This Home
This home is located at 6317 Sabastian Ct, Columbus, OH 43213 and is currently estimated at $225,323, approximately $133 per square foot. 6317 Sabastian Ct is a home located in Franklin County with nearby schools including Olde Orchard Elementary School, Sherwood Middle School, and Walnut Ridge High School.
Ownership History
Date
Name
Owned For
Owner Type
Purchase Details
Closed on
Jul 31, 2012
Sold by
Miller Daniel A and Newell Debra A
Bought by
Wareti Sara
Current Estimated Value
Home Financials for this Owner
Home Financials are based on the most recent Mortgage that was taken out on this home.
Original Mortgage
$71,677
Outstanding Balance
$49,608
Interest Rate
3.65%
Mortgage Type
FHA
Estimated Equity
$175,715
Purchase Details
Closed on
Mar 13, 2012
Sold by
Estate Of Mary A Miller
Bought by
Miller Daniel A and Newell Debra A
Purchase Details
Closed on
Jan 3, 2002
Sold by
Bourke Timothy M
Bought by
Miller James N and Miller Mary A
Purchase Details
Closed on
Sep 8, 1999
Sold by
Currie Mary N
Bought by
Bourke Timothy M
Home Financials for this Owner
Home Financials are based on the most recent Mortgage that was taken out on this home.
Original Mortgage
$70,000
Interest Rate
7.77%
Mortgage Type
Purchase Money Mortgage
Purchase Details
Closed on
Dec 4, 1991
Bought by
Currie Mary N
Purchase Details
Closed on
Mar 11, 1987
Create a Home Valuation Report for This Property
The Home Valuation Report is an in-depth analysis detailing your home's value as well as a comparison with similar homes in the area
Home Values in the Area
Average Home Value in this Area
Purchase History
| Date | Buyer | Sale Price | Title Company |
|---|---|---|---|
| Wareti Sara | $73,000 | None Available | |
| Miller Daniel A | -- | None Available | |
| Miller James N | $125,000 | -- | |
| Bourke Timothy M | $113,000 | George Pritsolas Title | |
| Currie Mary N | $85,000 | -- | |
| -- | $79,100 | -- |
Source: Public Records
Mortgage History
| Date | Status | Borrower | Loan Amount |
|---|---|---|---|
| Open | Wareti Sara | $71,677 | |
| Previous Owner | Bourke Timothy M | $70,000 |
Source: Public Records
Tax History Compared to Growth
Tax History
| Year | Tax Paid | Tax Assessment Tax Assessment Total Assessment is a certain percentage of the fair market value that is determined by local assessors to be the total taxable value of land and additions on the property. | Land | Improvement |
|---|---|---|---|---|
| 2024 | $2,817 | $62,760 | $11,900 | $50,860 |
| 2023 | $2,781 | $62,760 | $11,900 | $50,860 |
| 2022 | $2,309 | $44,520 | $6,160 | $38,360 |
| 2021 | $2,313 | $44,520 | $6,160 | $38,360 |
| 2020 | $2,316 | $44,520 | $6,160 | $38,360 |
| 2019 | $2,077 | $34,240 | $4,730 | $29,510 |
| 2018 | $1,871 | $34,240 | $4,730 | $29,510 |
| 2017 | $1,957 | $34,240 | $4,730 | $29,510 |
| 2016 | $1,839 | $27,760 | $4,620 | $23,140 |
| 2015 | $1,669 | $27,760 | $4,620 | $23,140 |
| 2014 | $1,673 | $27,760 | $4,620 | $23,140 |
| 2013 | $1,031 | $34,685 | $5,775 | $28,910 |
Source: Public Records
Map
Nearby Homes
- 6279 Braiden Ct Unit 10B
- 541 Woodingham Place Unit 2-C
- 557 Woodingham Place Unit 1A
- 6258 Peach Tree Rd
- 651 Cranfield Place
- 6231 Peach Tree Rd
- 6056 Naughten Pond Dr
- 6052 Naughten Pond Dr
- 6040 Naughten Pond Dr
- 6560 Schenk Ave
- 6610 Olivetree Ct
- 807 McNaughten Rd
- 6483 Borr Ave
- 6626 Red Fox Rd
- 6033 McNaughten Grove Ln
- 117 Stornoway Dr E
- 6198 Stornoway Dr S Unit 6198
- 85 Stornoway Dr W Unit 85
- 6737 Rocky Den Rd
- 147 Shadymere Ln Unit 5
- 6317 Sabastian Ct Unit A
- 6319 Sabastian Ct
- 6323 Sabastian Ct
- 6321 Sabastian Ct
- 6321 Sabastian Ct Unit C
- 6311 Sabastian Ct Unit 42D
- 6307 Sabastian Ct
- 6311 Sabastian Ct Unit D
- 6309 Sabastian Ct
- 534 Camdenway Ct
- 505 Durbin Rd
- 509 Durbin Rd Unit 41/B
- 507 Durbin Rd
- 507 Durbin Rd Unit C
- 553 Big Ben Ln
- 553 Big Ben Ln Unit A
- 511 Durbin Rd
- 511 Durbin Rd Unit A
- 536 Camdenway Ct Unit 47C
- 6305 Sabastian Ct Unit 42A