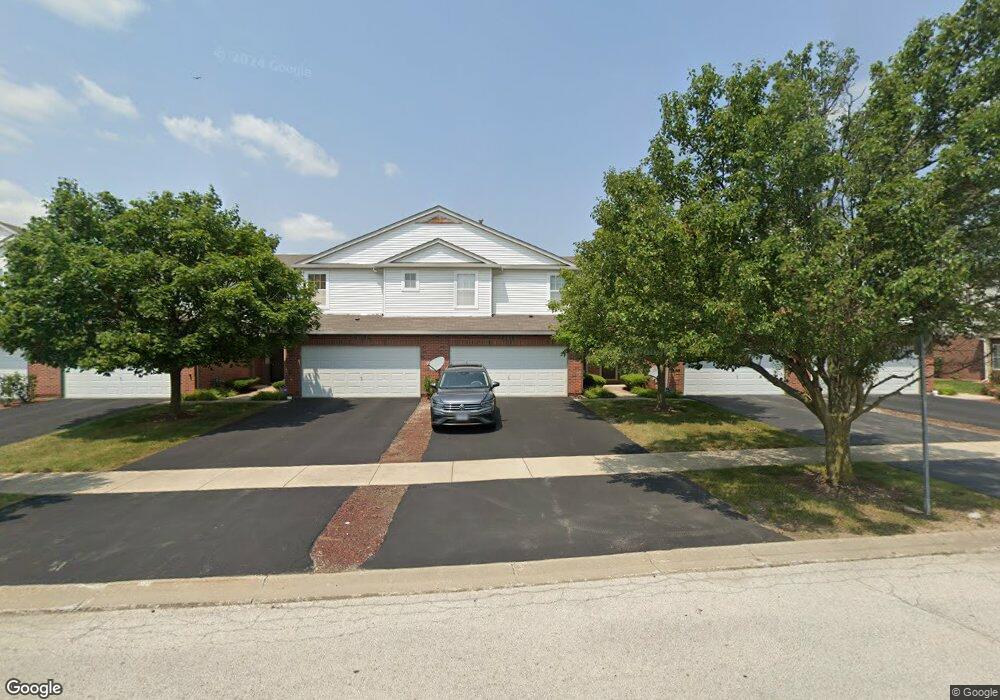
6318 Pond View Dr Unit 1154 Matteson, IL 60443
West Matteson NeighborhoodEstimated Value: $244,562 - $292,000
2
Beds
1
Bath
157,824
Sq Ft
$2/Sq Ft
Est. Value
About This Home
This home is located at 6318 Pond View Dr Unit 1154, Matteson, IL 60443 and is currently estimated at $271,391, approximately $1 per square foot. 6318 Pond View Dr Unit 1154 is a home located in Cook County with nearby schools including Colin Powell Middle School.
Ownership History
Date
Name
Owned For
Owner Type
Purchase Details
Closed on
Sep 27, 2021
Sold by
Latalladi Pierre and Latalladi Tracy E
Bought by
Counts Crystal
Current Estimated Value
Home Financials for this Owner
Home Financials are based on the most recent Mortgage that was taken out on this home.
Original Mortgage
$182,631
Outstanding Balance
$168,728
Interest Rate
3.75%
Mortgage Type
FHA
Estimated Equity
$102,663
Purchase Details
Closed on
Nov 14, 2013
Sold by
Latalladi Tracy E and Urbanski Tracy E
Bought by
Latalladi Tracy E and Latalladi Pierre
Home Financials for this Owner
Home Financials are based on the most recent Mortgage that was taken out on this home.
Original Mortgage
$130,789
Interest Rate
4.62%
Mortgage Type
FHA
Purchase Details
Closed on
Jun 30, 2005
Sold by
Montalbano Builders Inc
Bought by
Urbanski Tracy E
Home Financials for this Owner
Home Financials are based on the most recent Mortgage that was taken out on this home.
Original Mortgage
$150,700
Interest Rate
5.69%
Mortgage Type
FHA
Create a Home Valuation Report for This Property
The Home Valuation Report is an in-depth analysis detailing your home's value as well as a comparison with similar homes in the area
Home Values in the Area
Average Home Value in this Area
Purchase History
| Date | Buyer | Sale Price | Title Company |
|---|---|---|---|
| Counts Crystal | $186,000 | Fidelity National Title | |
| Latalladi Tracy E | -- | None Available | |
| Urbanski Tracy E | $165,000 | Cti |
Source: Public Records
Mortgage History
| Date | Status | Borrower | Loan Amount |
|---|---|---|---|
| Open | Counts Crystal | $182,631 | |
| Previous Owner | Latalladi Tracy E | $130,789 | |
| Previous Owner | Urbanski Tracy E | $150,700 |
Source: Public Records
Tax History Compared to Growth
Tax History
| Year | Tax Paid | Tax Assessment Tax Assessment Total Assessment is a certain percentage of the fair market value that is determined by local assessors to be the total taxable value of land and additions on the property. | Land | Improvement |
|---|---|---|---|---|
| 2024 | $8,171 | $19,713 | $748 | $18,965 |
| 2023 | $5,546 | $19,713 | $748 | $18,965 |
| 2022 | $5,546 | $10,359 | $578 | $9,781 |
| 2021 | $3,798 | $10,358 | $578 | $9,780 |
| 2020 | $3,789 | $10,358 | $578 | $9,780 |
| 2019 | $2,918 | $8,771 | $544 | $8,227 |
| 2018 | $4,764 | $12,283 | $544 | $11,739 |
| 2017 | $4,664 | $12,283 | $544 | $11,739 |
| 2016 | $5,073 | $12,301 | $510 | $11,791 |
| 2015 | $4,918 | $12,301 | $510 | $11,791 |
| 2014 | $4,811 | $12,301 | $510 | $11,791 |
| 2013 | $5,622 | $14,850 | $510 | $14,340 |
Source: Public Records
Map
Nearby Homes
- 921 Fieldside Dr Unit 1231
- 906 Eagle Point Dr
- 1008 Willow Rd
- 6423 Gray Hawk Dr Unit 2716
- 1000 Warwick Dr
- 6200 Marsh Ln
- 6260 Sunflower Dr
- 6520 Bridle Path Dr
- 21222 Whitney Ave
- 6500 Pasture Side Trail
- 733 Old Meadow Rd
- 6409 Old Plank Blvd
- 21206 Sophia Dr
- 6608 Pasture Side Trail
- 6037 Spring Ln
- 6230 Streamwood Ln
- 6508 Fawn Ct
- 6021 Spring Ln
- 6201 Old Plank Blvd
- 1030 Regent Dr
- 6318 Pond View Dr Unit 1038
- 6320 Pond View Dr Unit 1153
- 6316 Pond View Dr Unit 1155
- 6322 Pond View Dr Unit 1152
- 6314 Pond View Dr Unit 1156
- 6312 Pond View Dr Unit 1161
- 6326 Pond View Dr Unit 1146
- 6328 Pond View Dr Unit 1145
- 6310 Pond View Dr Unit 1162
- 6308 Pond View Dr Unit 1163
- 6321 Pond View Dr Unit 1202
- 6306 Pond View Dr Unit 1164
- 6319 Pond View Dr Unit 1201
- 6319 Pond View Dr Unit 1
- 6323 Pond View Dr Unit 1203
- 6325 Pond View Dr Unit 1204
- 6330 Pond View Dr Unit 1144
- 6327 Pond View Dr Unit 1205
- 6332 Pond View Dr Unit 1143
- 911 Berry Path Trail Unit 1191