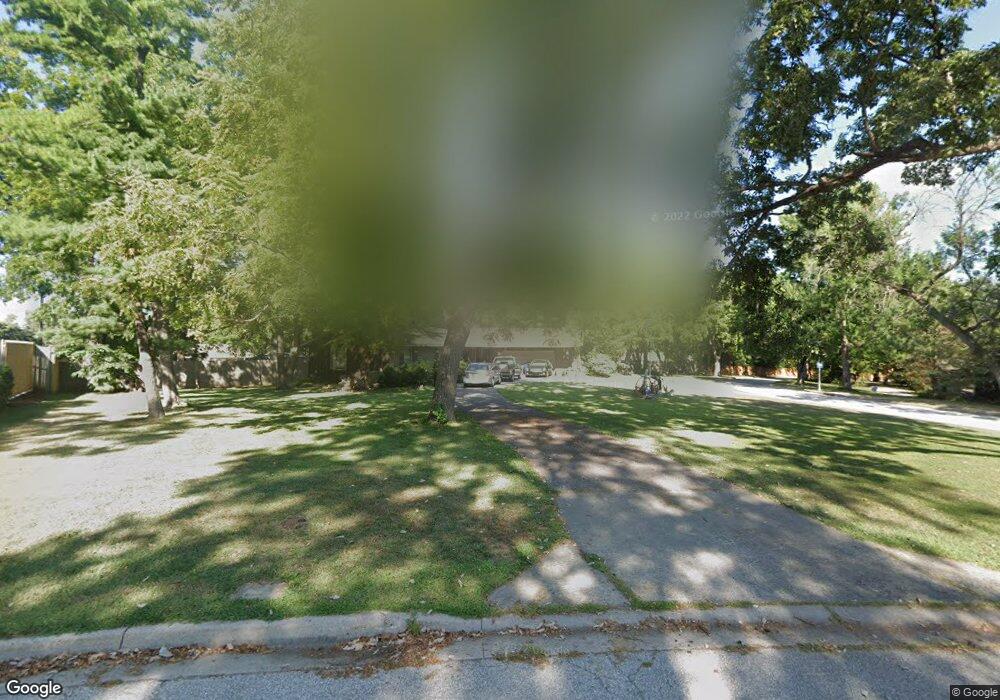
6319 Robinhood Ln Shawnee, KS 66203
Estimated Value: $400,000 - $450,000
3
Beds
2
Baths
2,226
Sq Ft
$188/Sq Ft
Est. Value
About This Home
This home is located at 6319 Robinhood Ln, Shawnee, KS 66203 and is currently estimated at $417,800, approximately $187 per square foot. 6319 Robinhood Ln is a home located in Johnson County with nearby schools including Merriam Park Elementary School, Hocker Grove Middle School, and Shawnee Mission North High School.
Ownership History
Date
Name
Owned For
Owner Type
Purchase Details
Closed on
Aug 29, 2006
Sold by
Keen Bule D
Bought by
Keen Dean Patrick
Current Estimated Value
Purchase Details
Closed on
Jul 22, 2002
Sold by
Keen Buel D and Keen Elinore
Bought by
Keen Buel D
Create a Home Valuation Report for This Property
The Home Valuation Report is an in-depth analysis detailing your home's value as well as a comparison with similar homes in the area
Home Values in the Area
Average Home Value in this Area
Purchase History
| Date | Buyer | Sale Price | Title Company |
|---|---|---|---|
| Keen Dean Patrick | -- | None Available | |
| Keen Buel D | -- | -- |
Source: Public Records
Tax History Compared to Growth
Tax History
| Year | Tax Paid | Tax Assessment Tax Assessment Total Assessment is a certain percentage of the fair market value that is determined by local assessors to be the total taxable value of land and additions on the property. | Land | Improvement |
|---|---|---|---|---|
| 2024 | $5,175 | $42,251 | $8,671 | $33,580 |
| 2023 | $4,665 | $39,215 | $8,671 | $30,544 |
| 2022 | $4,653 | $37,743 | $7,890 | $29,853 |
| 2021 | $4,491 | $34,799 | $6,846 | $27,953 |
| 2020 | $4,297 | $31,292 | $6,846 | $24,446 |
| 2019 | $3,438 | $29,463 | $5,954 | $23,509 |
| 2018 | $3,613 | $26,599 | $5,421 | $21,178 |
| 2017 | $3,570 | $24,288 | $5,421 | $18,867 |
| 2016 | $2,758 | $22,977 | $5,421 | $17,556 |
| 2015 | $2,556 | $21,447 | $5,421 | $16,026 |
| 2013 | -- | $20,964 | $5,421 | $15,543 |
Source: Public Records
Map
Nearby Homes
- 6420 Ballentine St
- 10924 W 67th St
- 10235 W 70th St
- 10103 Johnson Dr
- 10024 W 70th Terrace
- 5933 Knox Ave
- 11217 W 69th Terrace
- 9906 Edelweiss Cir
- 10406 W 71st Place
- 10914 W 71st St
- 10152 Edelweiss Cir
- 10236 Edelweiss Cir
- 10902 W 71st Place
- 11637 W 68th Terrace
- 6901 Grandview St
- 10314 W 73rd St
- 11406 W 71st St
- 7226 Edgewood Blvd
- 7240 Mastin St
- 7219 Reeder St
- 6321 Robinhood Ln
- 6321 Robin Hood Dr
- 6403 Switzer Ln
- 6403 Switzer St
- 6407 Switzer Ln
- 6407 Switzer St
- 6317 Robinhood Ln
- 6417 Switzer St
- 6417 Switzer Ln
- 6349 Switzer Ln
- 6311 Sherwood Ln
- 6349 Switzer St
- 6318 Robinhood Ln
- 6318 Robin Hood Dr
- 6323 Robinhood Dr
- 6323 Robinhood Dr
- 6421 Switzer St
- 6345 Switzer Ln
- 6345 Switzer St
- 6324 Robinhood Ln