6319 S Eberhart Ave Unit C Chicago, IL 60637
West Woodlawn NeighborhoodEstimated Value: $29,274 - $570,000
About This Home
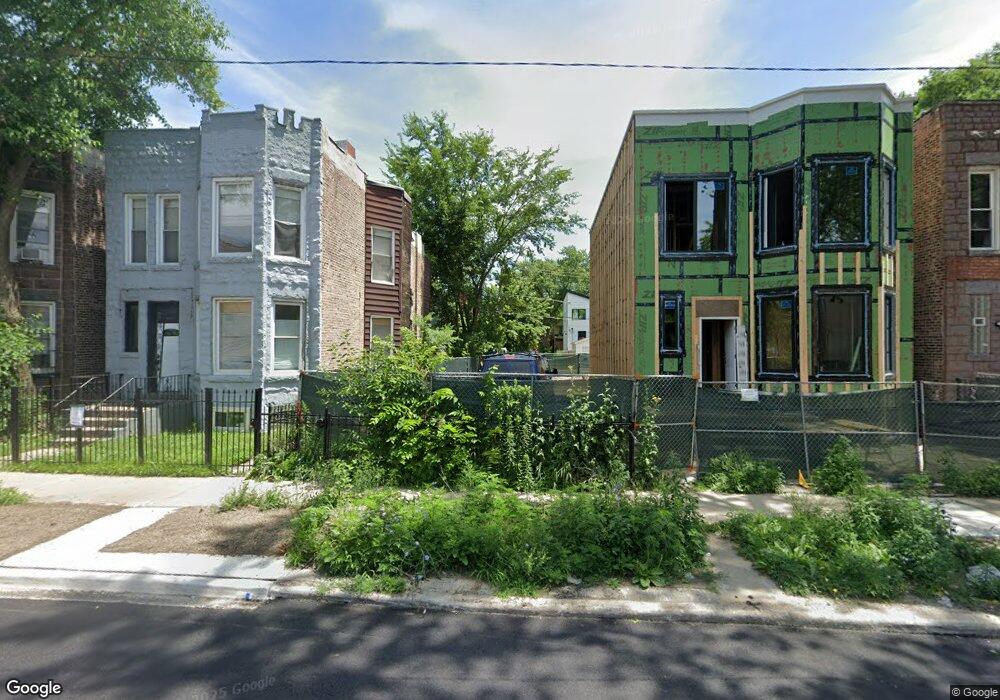
This home is located at 6319 S Eberhart Ave Unit C, Chicago, IL 60637 and is currently estimated at $299,637, approximately $137 per square foot. 6319 S Eberhart Ave Unit C is a home located in Cook County with nearby schools including Till Elementary Math & Science Academy, Hyde Park Academy High School, and Univ of Chicago Chtr-Woodlawn.
Ownership History
Purchase Details
Purchase Details
Purchase Details
Home Financials for this Owner
Home Financials are based on the most recent Mortgage that was taken out on this home.Purchase Details
Purchase Details
Home Values in the Area
Average Home Value in this Area
Purchase History
We collect this data history from publicly available records. To have your information removed, we recommend requesting removal directly through your county’s website.
| Date | Buyer | Sale Price | Title Company |
|---|---|---|---|
| Collard Aaron | $29,000 | First American Title | |
| Southside Assets Inc | -- | None Available | |
| A & R Capital Management Incorporation | $100,000 | None Available | |
| Cathey Leslie | -- | None Available | |
| Cathey Beulah M | -- | -- |
Mortgage History
We collect this data history from publicly available records. To have your information removed, we recommend requesting removal directly through your county’s website.
| Date | Status | Borrower | Loan Amount |
|---|---|---|---|
| Previous Owner | A & R Capital Management Incorporation | $61,750 |
Tax History
| Year | Tax Paid | Tax Assessment Tax Assessment Total Assessment is a certain percentage of the fair market value that is determined by local assessors to be the total taxable value of land and additions on the property. | Land | Improvement |
|---|---|---|---|---|
| 2025 | $807 | $3,813 | $3,813 | -- |
| 2024 | $807 | $3,813 | $3,813 | -- |
| 2023 | $784 | $3,813 | $3,813 | -- |
| 2022 | $784 | $3,813 | $3,813 | $0 |
| 2021 | $767 | $3,812 | $3,812 | $0 |
| 2020 | $3,026 | $13,585 | $3,812 | $9,773 |
| 2019 | $3,102 | $15,438 | $3,812 | $11,626 |
| 2018 | $3,049 | $15,438 | $3,812 | $11,626 |
| 2017 | $3,975 | $18,463 | $3,355 | $15,108 |
| 2016 | $3,698 | $18,463 | $3,355 | $15,108 |
| 2015 | $3,383 | $18,463 | $3,355 | $15,108 |
| 2014 | $2,955 | $15,927 | $2,745 | $13,182 |
| 2013 | $2,897 | $15,927 | $2,745 | $13,182 |
Map
- 6315 S Eberhart Ave
- 6336 S Eberhart Ave
- 500-512 E 63rd St
- 6354 S Rhodes Ave
- 6359 S Rhodes Ave
- 6334 S Saint Lawrence Ave
- 6405 S Eberhart Ave
- 6415 S Eberhart Ave
- 6417 S Rhodes Ave
- 6320 S Champlain Ave
- 6350 S Champlain Ave
- 6220 S King Dr
- 6451 S Vernon Ave
- 6418 S Champlain Ave
- 6441 S Saint Lawrence Ave
- 6141 S Eberhart Ave
- 6328 S Langley Ave
- 6126 S Vernon Ave
- 6429-6441 S Champlain Ave
- 6230 S Langley Ave
- 6321 S Eberhart Ave
- 6321 S Eberhart Ave Unit G
- 6321 S Eberhart Ave Unit 2
- 6321 S Eberhart Ave Unit 1
- 6319 S Eberhart Ave
- 6323 S Eberhart Ave
- 6323 S Eberhart Ave Unit G
- 6323 S Eberhart Ave Unit 2
- 6323 S Eberhart Ave
- 6317 S Eberhart Ave Unit 2
- 6317 S Eberhart Ave
- 6327 S Eberhart Ave
- 6315 S Eberhart Ave
- 6329 S Eberhart Ave
- 6331 S Eberhart Ave
- 6331 S Eberhart Ave
- 507 E 63rd St
- 6326 S Rhodes Ave Unit 2
- 6326 S Rhodes Ave Unit 1
- 6326 S Rhodes Ave Unit GA
Ask me questions while you tour the home.