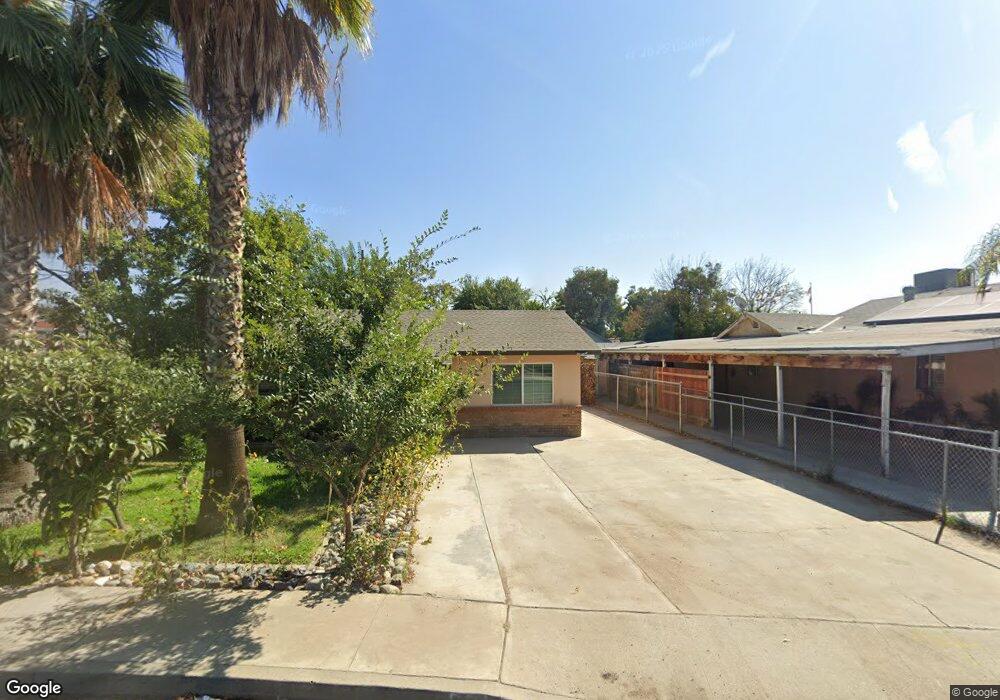
632 3rd St Mc Farland, CA 93250
Estimated Value: $216,000 - $279,391
3
Beds
2
Baths
850
Sq Ft
$301/Sq Ft
Est. Value
About This Home
This home is located at 632 3rd St, Mc Farland, CA 93250 and is currently estimated at $255,598, approximately $300 per square foot. 632 3rd St is a home located in Kern County with nearby schools including McFarland High School.
Ownership History
Date
Name
Owned For
Owner Type
Purchase Details
Closed on
May 14, 2004
Sold by
Jimenez Rosalinda
Bought by
Perezchica Juan Antonio and Perezchica Maria A
Current Estimated Value
Home Financials for this Owner
Home Financials are based on the most recent Mortgage that was taken out on this home.
Original Mortgage
$85,000
Outstanding Balance
$41,027
Interest Rate
5.92%
Mortgage Type
Purchase Money Mortgage
Estimated Equity
$214,571
Purchase Details
Closed on
Apr 26, 2002
Sold by
Lopez Rosalinda
Bought by
Jimenez Rosalinda
Home Financials for this Owner
Home Financials are based on the most recent Mortgage that was taken out on this home.
Original Mortgage
$35,000
Interest Rate
7.13%
Mortgage Type
Credit Line Revolving
Purchase Details
Closed on
Apr 14, 1999
Sold by
Jimenez Bentura Anthony
Bought by
Lopez Rosalinda
Purchase Details
Closed on
Aug 11, 1998
Sold by
Lopez Rosalinda
Bought by
Jimenez Bentura Anthony
Create a Home Valuation Report for This Property
The Home Valuation Report is an in-depth analysis detailing your home's value as well as a comparison with similar homes in the area
Home Values in the Area
Average Home Value in this Area
Purchase History
| Date | Buyer | Sale Price | Title Company |
|---|---|---|---|
| Perezchica Juan Antonio | $85,000 | Stewart Title | |
| Jimenez Rosalinda | -- | Stewart Title | |
| Jimenez Rosalinda | -- | -- | |
| Lopez Rosalinda | -- | -- | |
| Jimenez Bentura Anthony | -- | -- |
Source: Public Records
Mortgage History
| Date | Status | Borrower | Loan Amount |
|---|---|---|---|
| Open | Perezchica Juan Antonio | $85,000 | |
| Previous Owner | Jimenez Rosalinda | $35,000 |
Source: Public Records
Tax History
| Year | Tax Paid | Tax Assessment Tax Assessment Total Assessment is a certain percentage of the fair market value that is determined by local assessors to be the total taxable value of land and additions on the property. | Land | Improvement |
|---|---|---|---|---|
| 2025 | $1,475 | $120,829 | $28,423 | $92,406 |
| 2024 | $1,449 | $118,461 | $27,866 | $90,595 |
| 2023 | $1,449 | $116,139 | $27,320 | $88,819 |
| 2022 | $1,411 | $113,863 | $26,785 | $87,078 |
| 2021 | $1,340 | $111,631 | $26,260 | $85,371 |
| 2020 | $1,293 | $110,487 | $25,991 | $84,496 |
| 2019 | $1,219 | $110,487 | $25,991 | $84,496 |
| 2018 | $1,202 | $106,199 | $24,983 | $81,216 |
| 2017 | $1,171 | $104,118 | $24,494 | $79,624 |
| 2016 | $1,063 | $94,000 | $24,000 | $70,000 |
| 2015 | $936 | $83,000 | $21,000 | $62,000 |
| 2014 | $859 | $78,000 | $20,000 | $58,000 |
Source: Public Records
Map
Nearby Homes
- 249 Robertson Ave
- 830 Davis Ave
- 0 W Sherwood Ave Unit 202506495
- 0 W Sherwood Ave Unit 21453658
- 276 San Juan St
- 704 Cabo San Lucas Ct
- 124 4th Place
- 314 8th St
- 749 Browning Rd
- 733 Ensenata Dr
- 216 Browning Rd
- 254 E Sherwood Ave
- 148 San Lucas St
- 0 Costa Alyssa Dr Unit 202602697
- 0 E Sherwood Ave
- 737 Misty Ave
- 714 Hayden Ave
- 737 Concord Ct
- 805 Price St
- 799 Moscato St
Your Personal Tour Guide
Ask me questions while you tour the home.