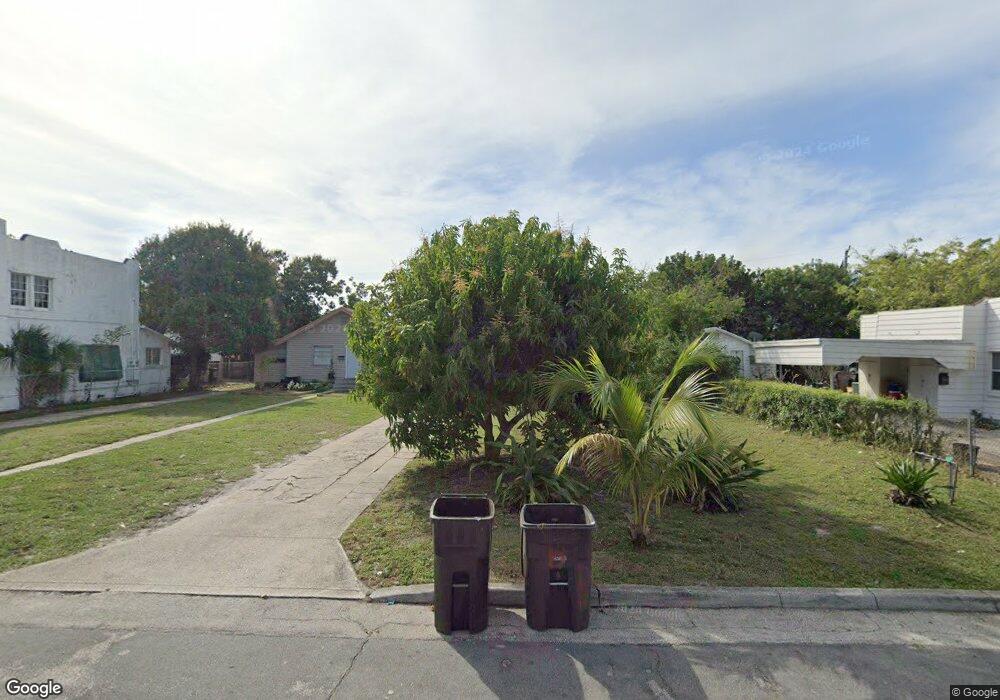
632 42nd St West Palm Beach, FL 33407
Northwood Hills NeighborhoodEstimated Value: $284,110 - $501,000
3
Beds
2
Baths
1,056
Sq Ft
$383/Sq Ft
Est. Value
About This Home
This home is located at 632 42nd St, West Palm Beach, FL 33407 and is currently estimated at $404,037, approximately $382 per square foot. 632 42nd St is a home located in Palm Beach County with nearby schools including Palm Beach Lakes High School, Ephesus Adventist Academy, and The Foundations School at Center for Creative Education.
Ownership History
Date
Name
Owned For
Owner Type
Purchase Details
Closed on
Nov 14, 2022
Sold by
Dipac Investment Llc
Bought by
Gurin Llc
Current Estimated Value
Purchase Details
Closed on
Feb 17, 2022
Sold by
Mohamed Cheryl I
Bought by
Dipac Investment Llc
Purchase Details
Closed on
Jul 10, 2021
Sold by
Pietro Sabrina and Teague Charles W
Bought by
Mohamed Cheryl and Pietro Sabrina
Purchase Details
Closed on
Mar 26, 2003
Sold by
Teague Samuel L
Bought by
Teague Charles W
Create a Home Valuation Report for This Property
The Home Valuation Report is an in-depth analysis detailing your home's value as well as a comparison with similar homes in the area
Home Values in the Area
Average Home Value in this Area
Purchase History
| Date | Buyer | Sale Price | Title Company |
|---|---|---|---|
| Gurin Llc | $370,000 | -- | |
| Dipac Investment Llc | $175,000 | Bay National Title | |
| Mohamed Cheryl | -- | Attorney | |
| Teague Charles W | $65,000 | -- |
Source: Public Records
Tax History Compared to Growth
Tax History
| Year | Tax Paid | Tax Assessment Tax Assessment Total Assessment is a certain percentage of the fair market value that is determined by local assessors to be the total taxable value of land and additions on the property. | Land | Improvement |
|---|---|---|---|---|
| 2024 | $4,581 | $202,160 | -- | -- |
| 2023 | $4,192 | $183,782 | $77,500 | $106,282 |
| 2022 | $3,395 | $142,081 | $0 | $0 |
| 2021 | $1,913 | $113,104 | $25,500 | $87,604 |
| 2020 | $1,850 | $111,285 | $25,500 | $85,785 |
| 2019 | $1,770 | $105,249 | $23,800 | $81,449 |
| 2018 | $1,394 | $80,990 | $17,221 | $63,769 |
| 2017 | $1,266 | $74,118 | $13,247 | $60,871 |
| 2016 | $1,215 | $31,024 | $0 | $0 |
| 2015 | $1,106 | $28,204 | $0 | $0 |
| 2014 | $1,066 | $25,640 | $0 | $0 |
Source: Public Records
Map
Nearby Homes
- 0 Broadway Unit F10486451
- 4301 Pinewood Ave
- 4108 Greenwood Ave
- 4300 Spruce Ave
- 620 46th St
- 4400 Greenwood Ave
- 531 45th St
- 4010 Greenwood Ave
- 4008 Greenwood Ave
- 513 45th St
- 707 46th St
- 808 41st St
- 3808 Broadway
- 3906 Greenwood Ave
- 439 45th St
- 401 42nd St
- 821 43rd St
- 627 47th St
- 3717 Pinewood Ave
- 643 36th St