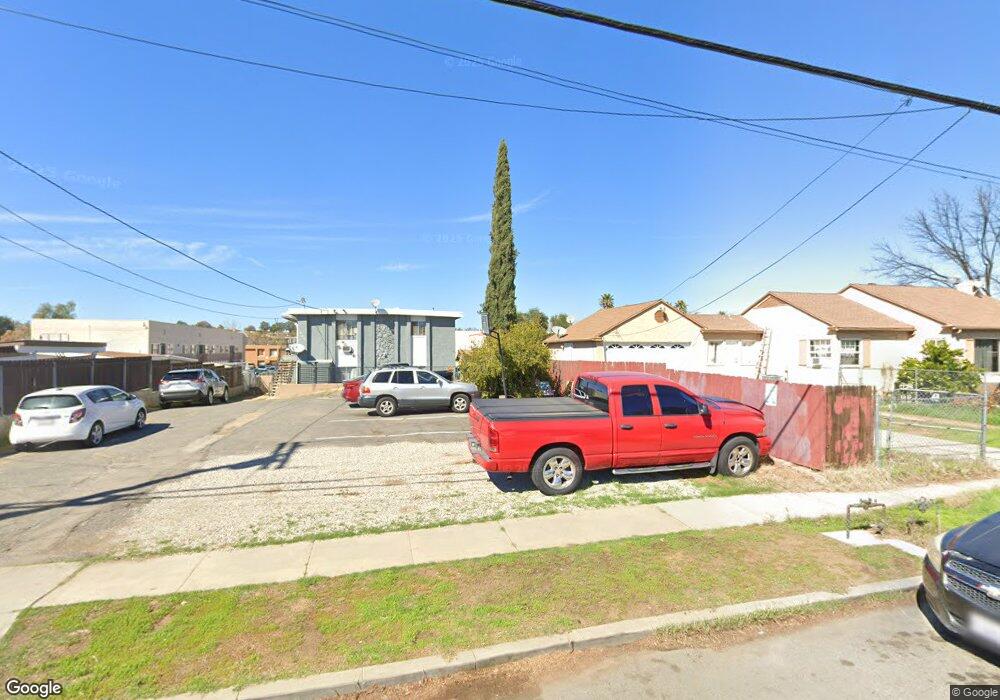
632 A St Unit 14 Ramona, CA 92065
Estimated Value: $314,000 - $357,000
2
Beds
1
Bath
884
Sq Ft
$375/Sq Ft
Est. Value
About This Home
This home is located at 632 A St Unit 14, Ramona, CA 92065 and is currently estimated at $331,902, approximately $375 per square foot. 632 A St Unit 14 is a home located in San Diego County with nearby schools including Ramona Elementary School, Olive Peirce Middle School, and Ramona High School.
Ownership History
Date
Name
Owned For
Owner Type
Purchase Details
Closed on
Mar 30, 2017
Sold by
Velica Carlos and Velica Rosario
Bought by
Velica Carlos
Current Estimated Value
Purchase Details
Closed on
Oct 22, 2012
Sold by
Harlan Mike
Bought by
Velica Carlos and Velica Rosario
Purchase Details
Closed on
Jun 12, 2012
Sold by
Cardenas Rigoberto and Cardenas Estefania
Bought by
Harlan Mike
Purchase Details
Closed on
Jun 15, 2005
Sold by
Rose Wilbur D and Rose Jane
Bought by
Cardenas Rigoberto and Cardenas Estefania
Home Financials for this Owner
Home Financials are based on the most recent Mortgage that was taken out on this home.
Original Mortgage
$191,200
Interest Rate
5.25%
Mortgage Type
Purchase Money Mortgage
Purchase Details
Closed on
Oct 4, 1991
Purchase Details
Closed on
Mar 22, 1988
Create a Home Valuation Report for This Property
The Home Valuation Report is an in-depth analysis detailing your home's value as well as a comparison with similar homes in the area
Home Values in the Area
Average Home Value in this Area
Purchase History
| Date | Buyer | Sale Price | Title Company |
|---|---|---|---|
| Velica Carlos | $32,000 | None Available | |
| Velica Carlos | $82,000 | Ticor Title | |
| Harlan Mike | $64,700 | None Available | |
| Cardenas Rigoberto | $239,000 | Commonwealth Title | |
| -- | $54,000 | -- | |
| -- | $29,000 | -- |
Source: Public Records
Mortgage History
| Date | Status | Borrower | Loan Amount |
|---|---|---|---|
| Previous Owner | Cardenas Rigoberto | $191,200 |
Source: Public Records
Tax History
| Year | Tax Paid | Tax Assessment Tax Assessment Total Assessment is a certain percentage of the fair market value that is determined by local assessors to be the total taxable value of land and additions on the property. | Land | Improvement |
|---|---|---|---|---|
| 2025 | $2,015 | $100,964 | $43,093 | $57,871 |
| 2024 | $2,015 | $98,986 | $42,249 | $56,737 |
| 2023 | $1,803 | $97,046 | $41,421 | $55,625 |
| 2022 | $1,976 | $95,144 | $40,609 | $54,535 |
| 2021 | $1,962 | $93,279 | $39,813 | $53,466 |
| 2020 | $1,955 | $92,323 | $39,405 | $52,918 |
| 2019 | $1,918 | $90,514 | $38,633 | $51,881 |
| 2018 | $1,876 | $88,740 | $37,876 | $50,864 |
| 2017 | $1,856 | $87,001 | $37,134 | $49,867 |
| 2016 | $1,804 | $85,296 | $36,406 | $48,890 |
| 2015 | $1,742 | $84,016 | $35,860 | $48,156 |
| 2014 | $1,681 | $82,371 | $35,158 | $47,213 |
Source: Public Records
Map
Nearby Homes
- 632 A St
- 632 A St Unit 13
- 632 A St Unit 12
- 632 A St Unit 11
- 632 A St Unit 10
- 632 A St Unit 9
- 632 A St Unit 8
- 632 A St Unit 7
- 632 A St Unit 6
- 632 A St Unit 5
- 632 A St Unit 4
- 632 A St Unit 3
- 632 A St Unit 2
- 632 A St Unit 1
- 632 A St Unit 29
- 632 A St Unit 28
- 632 A St Unit 27
- 632 A St Unit 26
- 632 A St Unit 25
- 632 A St Unit 24
Your Personal Tour Guide
Ask me questions while you tour the home.