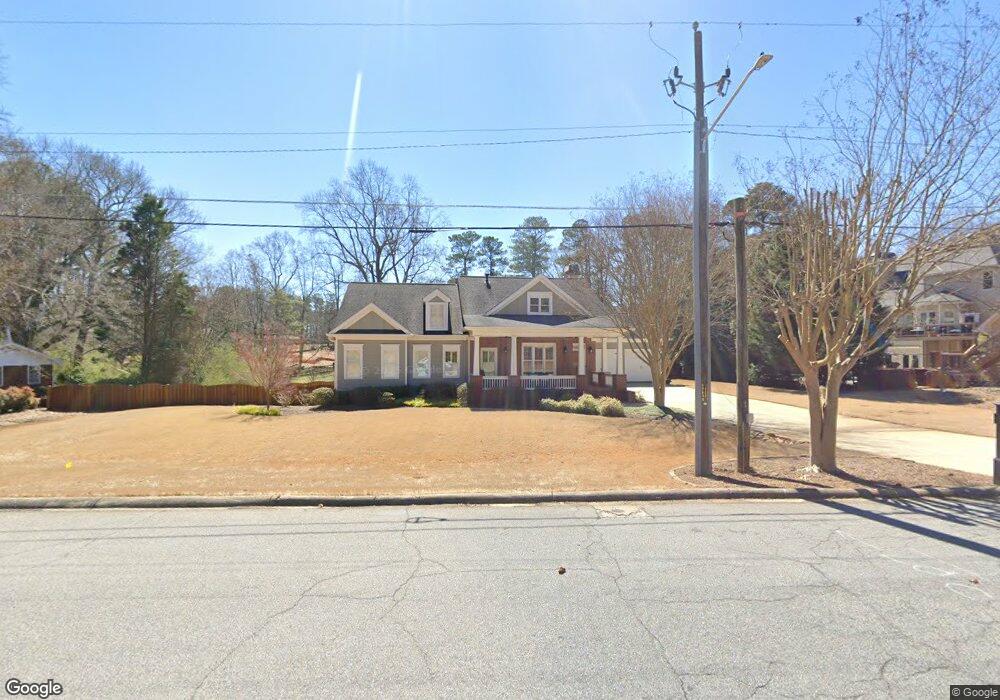
632 Austin Dr SE Smyrna, GA 30082
Estimated Value: $625,000 - $833,000
3
Beds
4
Baths
3,457
Sq Ft
$224/Sq Ft
Est. Value
About This Home
This home is located at 632 Austin Dr SE, Smyrna, GA 30082 and is currently estimated at $774,039, approximately $223 per square foot. 632 Austin Dr SE is a home located in Cobb County with nearby schools including King Springs Elementary School, Griffin Middle School, and Campbell High School.
Ownership History
Date
Name
Owned For
Owner Type
Purchase Details
Closed on
Apr 24, 2007
Sold by
Potter David E and Potter Sandra L
Bought by
Samani Lisa D and Samani David F
Current Estimated Value
Home Financials for this Owner
Home Financials are based on the most recent Mortgage that was taken out on this home.
Original Mortgage
$315,000
Outstanding Balance
$189,933
Interest Rate
6.1%
Mortgage Type
New Conventional
Estimated Equity
$584,106
Purchase Details
Closed on
Nov 23, 2004
Sold by
Kelley James S
Bought by
Potter David E and Potter Sandra
Home Financials for this Owner
Home Financials are based on the most recent Mortgage that was taken out on this home.
Original Mortgage
$55,000
Interest Rate
5.62%
Mortgage Type
New Conventional
Purchase Details
Closed on
Dec 27, 2000
Sold by
Wilcox Rosemarie
Bought by
Kelley James S and Kelley Cheri
Create a Home Valuation Report for This Property
The Home Valuation Report is an in-depth analysis detailing your home's value as well as a comparison with similar homes in the area
Home Values in the Area
Average Home Value in this Area
Purchase History
| Date | Buyer | Sale Price | Title Company |
|---|---|---|---|
| Samani Lisa D | $430,000 | -- | |
| Potter David E | $436,000 | -- | |
| Kelley James S | $52,000 | -- |
Source: Public Records
Mortgage History
| Date | Status | Borrower | Loan Amount |
|---|---|---|---|
| Open | Samani Lisa D | $315,000 | |
| Previous Owner | Potter David E | $55,000 |
Source: Public Records
Tax History Compared to Growth
Tax History
| Year | Tax Paid | Tax Assessment Tax Assessment Total Assessment is a certain percentage of the fair market value that is determined by local assessors to be the total taxable value of land and additions on the property. | Land | Improvement |
|---|---|---|---|---|
| 2025 | $7,083 | $323,572 | $85,164 | $238,408 |
| 2024 | $7,083 | $323,572 | $85,164 | $238,408 |
| 2023 | $5,342 | $256,612 | $79,728 | $176,884 |
| 2022 | $5,444 | $233,540 | $79,728 | $153,812 |
| 2021 | $5,034 | $210,396 | $77,916 | $132,480 |
| 2020 | $4,792 | $197,712 | $65,232 | $132,480 |
| 2019 | $4,689 | $192,276 | $59,796 | $132,480 |
| 2018 | $4,462 | $180,344 | $56,172 | $124,172 |
| 2017 | $4,044 | $171,284 | $47,112 | $124,172 |
| 2016 | $3,908 | $164,036 | $39,864 | $124,172 |
| 2015 | $3,522 | $143,268 | $34,428 | $108,840 |
| 2014 | $3,324 | $134,584 | $0 | $0 |
Source: Public Records
Map
Nearby Homes
- 1522 Grace Meadows Ln SE
- 4222 Terrace Ct SE
- 3933 N Cooper Lake Rd SE
- 3844 Lake Dr SE
- 538 Micayne Cir SE Unit 3
- 550 Micayne Cir SE Unit 1
- 3538 S Sherwood Rd SE Unit 5
- 436 Concord Rd SE
- 3941 Lake Dr SE
- 3654 Lake Dr SE
- 3568 Lake Dr SE
- 3462 S Sherwood Rd SE
- 317 Highview Dr SE
- 629 Dunton Cir SE
- 418 Mockingbird Ln SE
- 576 N Thomas Ln SE
- 622 Austin Dr SE
- 3793 N Cooper Lake Rd SE
- 1504 Grace Meadows Ln SE
- 1506 Grace Meadows Ln SE
- 1502 Grace Meadows Ln SE
- 1508 Grace Meadows Ln SE
- 652 Austin Dr SE
- 1510 Grace Meadows Ln SE Unit 3
- 1510 Grace Meadows Ln SE
- 1500 Grace Meadows Ln SE
- 662 Austin Dr SE
- 1505 Grace Meadows Ln SE
- 3768 N Cooper Lake Rd SE
- 1507 Grace Meadows Ln SE
- 1509 Grace Meadows Ln SE
- 1512 Grace Meadows Ln SE
- 3778 N Cooper Lake Rd SE
- 3754 N Cooper Lake Rd SE
- 1503 Grace Meadows Ln SE
- 1511 Grace Meadows Ln SE