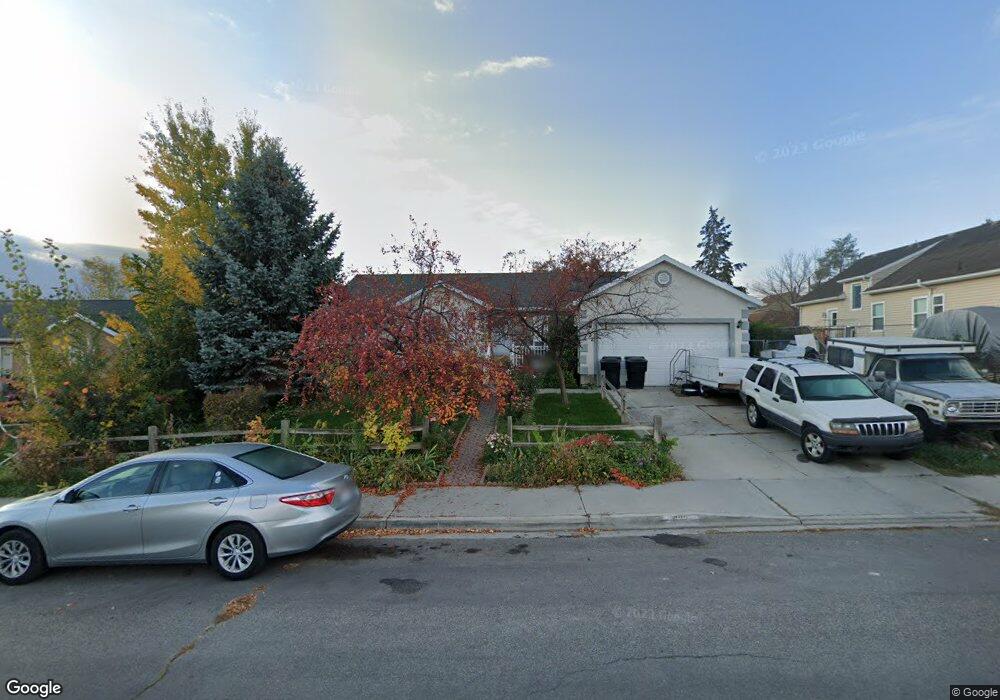
632 E 200 N Payson, UT 84651
Estimated Value: $483,036 - $500,000
3
Beds
3
Baths
1,288
Sq Ft
$383/Sq Ft
Est. Value
About This Home
This home is located at 632 E 200 N, Payson, UT 84651 and is currently estimated at $493,345, approximately $383 per square foot. 632 E 200 N is a home located in Utah County with nearby schools including Barnett Elementary School, Salem Junior High School, and Valley View Middle School.
Ownership History
Date
Name
Owned For
Owner Type
Purchase Details
Closed on
Apr 10, 2003
Sold by
Rural Housing Development Corp
Bought by
Rash David Allen and Rash Kirstine
Current Estimated Value
Home Financials for this Owner
Home Financials are based on the most recent Mortgage that was taken out on this home.
Original Mortgage
$122,000
Outstanding Balance
$64,911
Interest Rate
5.72%
Mortgage Type
USDA
Estimated Equity
$428,434
Purchase Details
Closed on
May 21, 2002
Sold by
Anderson Jo Ann Smith
Bought by
Rural Housing Development Corp
Home Financials for this Owner
Home Financials are based on the most recent Mortgage that was taken out on this home.
Original Mortgage
$30,303
Interest Rate
6.94%
Create a Home Valuation Report for This Property
The Home Valuation Report is an in-depth analysis detailing your home's value as well as a comparison with similar homes in the area
Home Values in the Area
Average Home Value in this Area
Purchase History
| Date | Buyer | Sale Price | Title Company |
|---|---|---|---|
| Rash David Allen | -- | Backman Stewart Title Servi | |
| Rural Housing Development Corp | -- | Old Republic Title Company |
Source: Public Records
Mortgage History
| Date | Status | Borrower | Loan Amount |
|---|---|---|---|
| Open | Rash David Allen | $122,000 | |
| Previous Owner | Rural Housing Development Corp | $30,303 | |
| Closed | Rash David Allen | $5,000 |
Source: Public Records
Tax History
| Year | Tax Paid | Tax Assessment Tax Assessment Total Assessment is a certain percentage of the fair market value that is determined by local assessors to be the total taxable value of land and additions on the property. | Land | Improvement |
|---|---|---|---|---|
| 2025 | $2,250 | $249,315 | -- | -- |
| 2024 | $2,250 | $228,965 | $0 | $0 |
| 2023 | $2,228 | $227,370 | $0 | $0 |
| 2022 | $2,293 | $230,120 | $0 | $0 |
| 2021 | $1,944 | $312,900 | $85,900 | $227,000 |
| 2020 | $1,845 | $290,600 | $78,100 | $212,500 |
| 2019 | $1,708 | $275,800 | $69,900 | $205,900 |
| 2018 | $1,552 | $241,500 | $62,500 | $179,000 |
| 2017 | $1,505 | $126,005 | $0 | $0 |
| 2016 | $1,362 | $113,245 | $0 | $0 |
| 2015 | $1,276 | $105,380 | $0 | $0 |
| 2014 | $1,234 | $102,685 | $0 | $0 |
Source: Public Records
Map
Nearby Homes
Your Personal Tour Guide
Ask me questions while you tour the home.