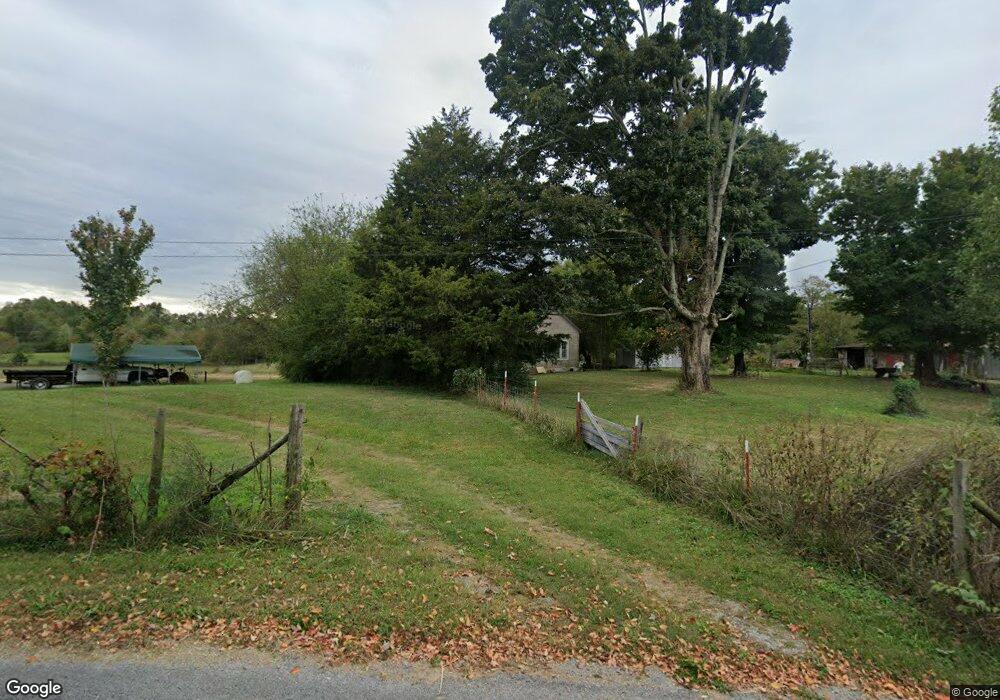
632 Joe Hart Rd Shelbyville, TN 37160
Estimated Value: $289,000 - $461,000
--
Bed
1
Bath
1,583
Sq Ft
$261/Sq Ft
Est. Value
About This Home
This home is located at 632 Joe Hart Rd, Shelbyville, TN 37160 and is currently estimated at $412,772, approximately $260 per square foot. 632 Joe Hart Rd is a home located in Bedford County with nearby schools including Liberty Elementary School and Shelbyville Central High School.
Ownership History
Date
Name
Owned For
Owner Type
Purchase Details
Closed on
Apr 13, 2023
Sold by
Mullins Everette Watson
Bought by
Mullins Everette Watson
Current Estimated Value
Purchase Details
Closed on
Mar 14, 2019
Sold by
Mullins Everette Watson
Bought by
Hill J Ellen and Clifton David
Home Financials for this Owner
Home Financials are based on the most recent Mortgage that was taken out on this home.
Original Mortgage
$116,214
Interest Rate
4.4%
Mortgage Type
New Conventional
Purchase Details
Closed on
Jun 17, 2004
Sold by
Mullins Everette Watson
Bought by
Bicknell Ricky
Purchase Details
Closed on
Mar 30, 1999
Sold by
Watson Mullins and Watson Mary L
Bought by
Mullins Everette W
Purchase Details
Closed on
Mar 26, 1999
Sold by
Watson Mullins and Watson Mary L
Bought by
Watson Mullins and Watson Mary L
Purchase Details
Closed on
Apr 24, 1968
Bought by
Mullins Everett W and Mullins Mary
Purchase Details
Closed on
Jan 6, 1966
Purchase Details
Closed on
Feb 16, 1937
Create a Home Valuation Report for This Property
The Home Valuation Report is an in-depth analysis detailing your home's value as well as a comparison with similar homes in the area
Home Values in the Area
Average Home Value in this Area
Purchase History
| Date | Buyer | Sale Price | Title Company |
|---|---|---|---|
| Mullins Everette Watson | -- | None Listed On Document | |
| Hill J Ellen | $136,722 | None Available | |
| Bicknell Ricky | -- | -- | |
| Mullins Everette W | -- | -- | |
| Mullins Everette W | -- | -- | |
| Watson Mullins | $15,000 | -- | |
| Mullins Everett W | -- | -- | |
| -- | $15,000 | -- | |
| -- | -- | -- |
Source: Public Records
Mortgage History
| Date | Status | Borrower | Loan Amount |
|---|---|---|---|
| Previous Owner | Hill J Ellen | $116,214 |
Source: Public Records
Tax History Compared to Growth
Tax History
| Year | Tax Paid | Tax Assessment Tax Assessment Total Assessment is a certain percentage of the fair market value that is determined by local assessors to be the total taxable value of land and additions on the property. | Land | Improvement |
|---|---|---|---|---|
| 2025 | $1,100 | $47,300 | $0 | $0 |
| 2024 | $1,100 | $47,300 | $20,875 | $26,425 |
| 2023 | $1,100 | $47,300 | $20,875 | $26,425 |
| 2022 | $1,100 | $47,300 | $20,875 | $26,425 |
| 2021 | $930 | $47,300 | $20,875 | $26,425 |
| 2020 | $795 | $47,300 | $20,875 | $26,425 |
| 2019 | $1,019 | $29,900 | $17,300 | $12,600 |
| 2018 | $980 | $38,300 | $25,700 | $12,600 |
| 2017 | $980 | $38,300 | $25,700 | $12,600 |
| 2016 | $965 | $38,300 | $0 | $0 |
| 2015 | $965 | $38,300 | $0 | $0 |
| 2014 | $713 | $31,419 | $0 | $0 |
Source: Public Records
Map
Nearby Homes
- 692 Anderson Rd
- 109 Dogwood Ct
- 900 New Herman Rd
- 1043 New Herman Rd
- 1190 Flat Creek Hwy
- 487 County Line Rd
- 296 Womble Rd
- 44 Moore Ln
- 702 Williamson Hollow Rd
- 248 Old Flat Creek Rd
- 1236 Buckeye Rd
- 4581 Lynchburg Hwy
- 0 Possum Trott Rd Unit RTC2914915
- 2751 Lynchburg Hwy
- 0 Flat Creek Hwy
- 1881 New Herman Rd
- 0 Smith Chapel Dr Unit RTC2942027
- 830 Bobo Hollow Rd
- 0 Spankem Rd Unit RTC2818747
- 0 Mount Herman Rd
- 637 Joe Hart Rd
- 388 Glendale Rd
- 385 Glendale Rd
- 582 Joe Hart Rd
- 1715 Wiseman Rd
- 561 Joe Hart Rd
- 555 Joe Hart Rd
- 653 Joe Hart Rd
- 303 Glendale Rd
- 525 Joe Hart Rd
- 525 Joe Hart Rd
- 449 Joe Hart Rd
- 1475 Wiseman Rd
- 703 Leon Clifton Rd
- 1278 Wiseman Rd
- 1 Joe Hart Rd
- 290 George Reagor Rd
- 298 George Reagor Rd
- 1252 Anderson Rd
- 345 Joe Hart Rd