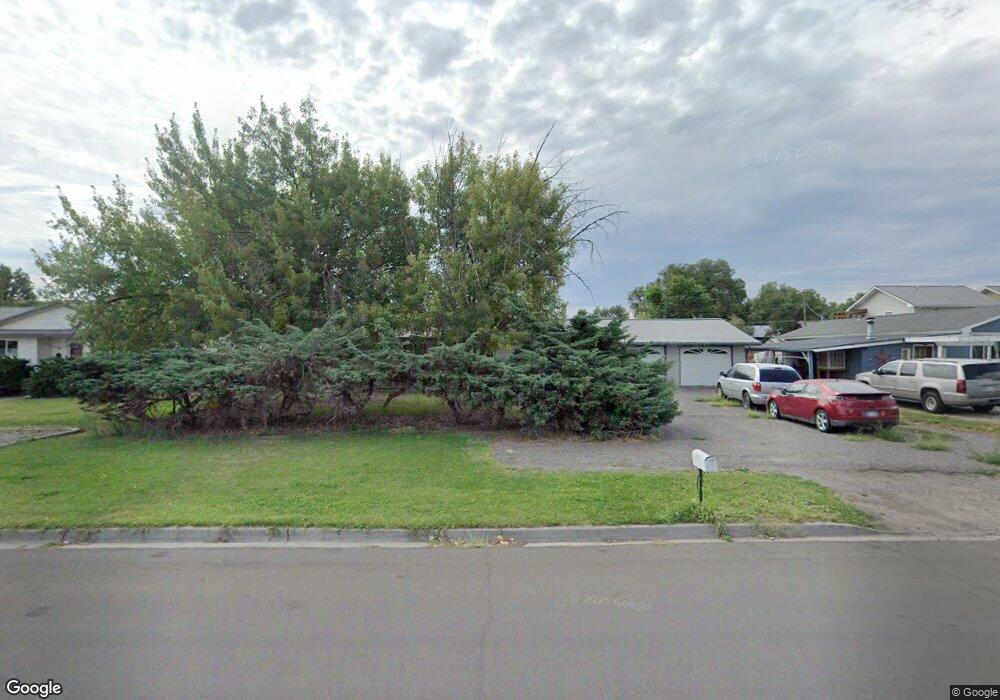
632 S 10th St Montrose, CO 81401
Estimated Value: $305,000 - $390,000
2
Beds
1
Bath
1,248
Sq Ft
$276/Sq Ft
Est. Value
About This Home
This home is located at 632 S 10th St, Montrose, CO 81401 and is currently estimated at $344,164, approximately $275 per square foot. 632 S 10th St is a home located in Montrose County with nearby schools including Pomona Elementary School, Columbine Middle School, and Montrose High School.
Ownership History
Date
Name
Owned For
Owner Type
Purchase Details
Closed on
Oct 15, 2010
Sold by
Sanderson Lawrence W and Sanderson Jalita R
Bought by
Sanderson Lawrence W and Sanderson Jalita R
Current Estimated Value
Home Financials for this Owner
Home Financials are based on the most recent Mortgage that was taken out on this home.
Original Mortgage
$108,500
Outstanding Balance
$71,708
Interest Rate
4.38%
Mortgage Type
New Conventional
Estimated Equity
$272,456
Purchase Details
Closed on
Apr 10, 1998
Sold by
Felix Juan A and Felix Sharon L
Bought by
Sanderson Lawrence W and Prisbrey Jalita R
Purchase Details
Closed on
Aug 16, 1995
Sold by
Barnes Robert C and Barnes Theresa A
Bought by
Felix Juan A and Felix Sharon L
Purchase Details
Closed on
Sep 26, 1986
Sold by
Noska Jacqueline M
Bought by
Barnes Robert C and Barnes Theresa A
Purchase Details
Closed on
Sep 29, 1976
Sold by
Lara Hector H and Lara Bernice A
Bought by
Noska Ernest W and Noska Jacqueline M
Create a Home Valuation Report for This Property
The Home Valuation Report is an in-depth analysis detailing your home's value as well as a comparison with similar homes in the area
Home Values in the Area
Average Home Value in this Area
Purchase History
| Date | Buyer | Sale Price | Title Company |
|---|---|---|---|
| Sanderson Lawrence W | -- | None Available | |
| Sanderson Lawrence W | $87,500 | -- | |
| Felix Juan A | $80,000 | -- | |
| Barnes Robert C | $43,200 | -- | |
| Noska Ernest W | $32,000 | -- |
Source: Public Records
Mortgage History
| Date | Status | Borrower | Loan Amount |
|---|---|---|---|
| Open | Sanderson Lawrence W | $108,500 |
Source: Public Records
Tax History Compared to Growth
Tax History
| Year | Tax Paid | Tax Assessment Tax Assessment Total Assessment is a certain percentage of the fair market value that is determined by local assessors to be the total taxable value of land and additions on the property. | Land | Improvement |
|---|---|---|---|---|
| 2024 | $1,350 | $18,960 | $3,550 | $15,410 |
| 2023 | $1,350 | $23,490 | $4,400 | $19,090 |
| 2022 | $1,157 | $16,820 | $3,200 | $13,620 |
| 2021 | $1,193 | $17,300 | $3,290 | $14,010 |
| 2020 | $976 | $14,540 | $2,840 | $11,700 |
| 2019 | $982 | $14,540 | $2,840 | $11,700 |
| 2018 | $779 | $11,250 | $2,290 | $8,960 |
| 2017 | $772 | $11,250 | $2,290 | $8,960 |
| 2016 | $727 | $10,760 | $2,310 | $8,450 |
| 2015 | $714 | $10,760 | $2,310 | $8,450 |
| 2014 | $541 | $8,730 | $2,310 | $6,420 |
Source: Public Records
Map
Nearby Homes
- 902 S Mesa Ave
- 535 S 11th St Unit 5
- 909 S 10th St
- 814 S 7th St
- 612 & 616 S 6th
- 1413 Chatam Dr
- 1205 Dover Rd
- 9 Aspen St
- TBD S 4th St
- 85 Colorado Ave
- 1128 Highland Dr
- 1131 S 12th St
- 103 Duncan Place
- 122 Spruce Dr
- 119 Akard Ave
- TBD Montrose Dr Site C
- TBD Lot 12 E Star Ct
- TBD Lot 11 E Star Ct
- TBD Lot 10 E Star Ct
- TBD Lot 9 E Star Ct
- 620 S 10th St
- 642 S 10th St
- 1001 S Park Ave
- 635 S 11th St
- 610 S 10th St
- 609 S 11th St
- 1030 S Mesa Ave
- 1025 S Park Ave
- 604 S 10th St
- 1029 S Park Ave
- 631 S 10th St
- 627 S 10th St
- 647 S 10th St
- S Park St
- 601 S 10th St
- 601 S 10th St Unit 601-605
- 1005 S Mesa Ave
- Lot 20-22 S 10th St
- S S 10th St Unit 521 1/2 S 10th Stree
- S S 10th St Unit 521 1/2 S 10th St