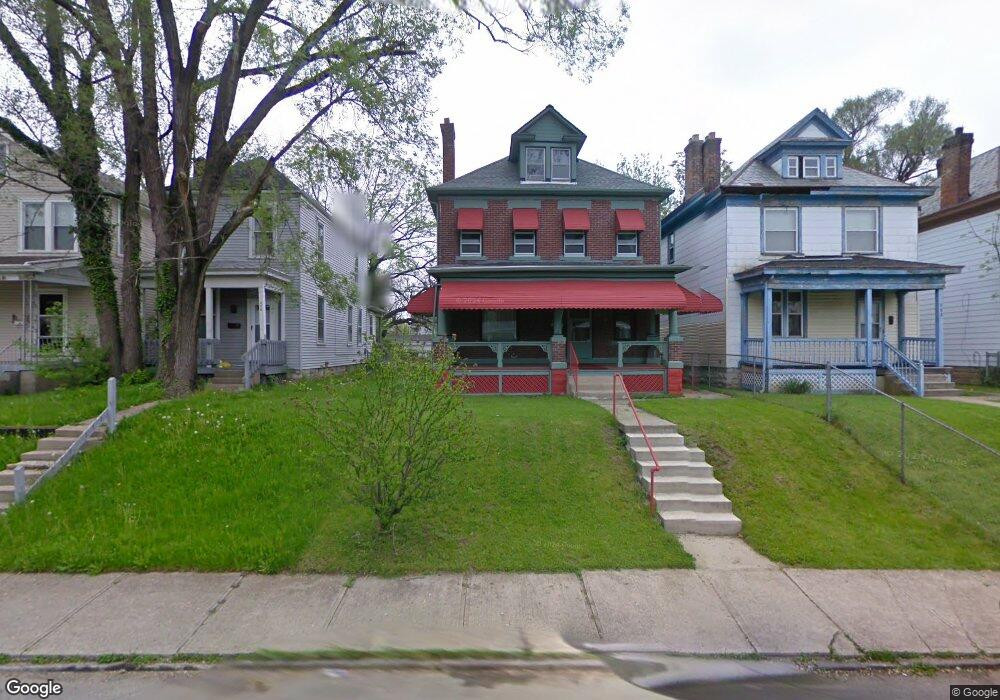
632 S 22nd St Columbus, OH 43205
Livingston Park NeighborhoodEstimated Value: $320,000 - $350,000
3
Beds
2
Baths
1,842
Sq Ft
$182/Sq Ft
Est. Value
About This Home
This home is located at 632 S 22nd St, Columbus, OH 43205 and is currently estimated at $334,985, approximately $181 per square foot. 632 S 22nd St is a home located in Franklin County with nearby schools including Livingston Elementary School, South High School, and Capital Collegiate Preparatory Academy.
Ownership History
Date
Name
Owned For
Owner Type
Purchase Details
Closed on
Jun 6, 2012
Sold by
Colwell-Ennis Ruth H
Bought by
Ennis Charles D
Current Estimated Value
Purchase Details
Closed on
Nov 5, 2008
Sold by
Colwell Ennis Ruth H and Ennis Charles D
Bought by
Colwell Ennis Ruth H and Ennis Charles D
Home Financials for this Owner
Home Financials are based on the most recent Mortgage that was taken out on this home.
Original Mortgage
$55,549
Outstanding Balance
$7,702
Interest Rate
5.03%
Mortgage Type
FHA
Estimated Equity
$327,283
Purchase Details
Closed on
Dec 27, 1995
Sold by
Robert R Baur Trst
Bought by
Ruth H Colwell
Home Financials for this Owner
Home Financials are based on the most recent Mortgage that was taken out on this home.
Original Mortgage
$54,958
Interest Rate
7.42%
Mortgage Type
New Conventional
Purchase Details
Closed on
Jan 14, 1994
Create a Home Valuation Report for This Property
The Home Valuation Report is an in-depth analysis detailing your home's value as well as a comparison with similar homes in the area
Home Values in the Area
Average Home Value in this Area
Purchase History
| Date | Buyer | Sale Price | Title Company |
|---|---|---|---|
| Ennis Charles D | -- | None Available | |
| Colwell Ennis Ruth H | -- | Attorney | |
| Ruth H Colwell | $53,000 | -- | |
| -- | $55,000 | -- |
Source: Public Records
Mortgage History
| Date | Status | Borrower | Loan Amount |
|---|---|---|---|
| Open | Colwell Ennis Ruth H | $55,549 | |
| Closed | Ruth H Colwell | $54,958 |
Source: Public Records
Tax History Compared to Growth
Tax History
| Year | Tax Paid | Tax Assessment Tax Assessment Total Assessment is a certain percentage of the fair market value that is determined by local assessors to be the total taxable value of land and additions on the property. | Land | Improvement |
|---|---|---|---|---|
| 2024 | $4,715 | $105,070 | $28,420 | $76,650 |
| 2023 | $4,846 | $105,070 | $28,420 | $76,650 |
| 2022 | $1,692 | $32,630 | $5,010 | $27,620 |
| 2021 | $1,695 | $32,630 | $5,010 | $27,620 |
| 2020 | $1,698 | $32,630 | $5,010 | $27,620 |
| 2019 | $1,623 | $26,750 | $4,170 | $22,580 |
| 2018 | $1,425 | $26,750 | $4,170 | $22,580 |
| 2017 | $1,622 | $26,750 | $4,170 | $22,580 |
| 2016 | $1,357 | $20,480 | $3,850 | $16,630 |
| 2015 | $1,232 | $20,480 | $3,850 | $16,630 |
| 2014 | $1,235 | $20,480 | $3,850 | $16,630 |
| 2013 | $641 | $21,560 | $4,060 | $17,500 |
Source: Public Records
Map
Nearby Homes
- 662 S 22nd St Unit 664
- 618 S 22nd St
- 665 S 22nd St
- 669 S 22nd St
- 338 S Ohio Ave
- 674 S Ohio Ave
- 688 S Ohio Ave
- 1036 Newton St Unit 38
- 576 Gilbert St
- 712 S Ohio Ave
- 631-633 S Champion Ave
- 575 Gilbert St
- 571 Gilbert St
- 730 S Champion Ave
- 903 E Livingston Ave
- 786 S Ohio Ave
- 791-793 S Champion Ave
- 785 Gilbert St
- 517 S Champion Ave
- 0 Carpenter St