Estimated Value: $120,000 - $150,000
3
Beds
1
Bath
912
Sq Ft
$153/Sq Ft
Est. Value
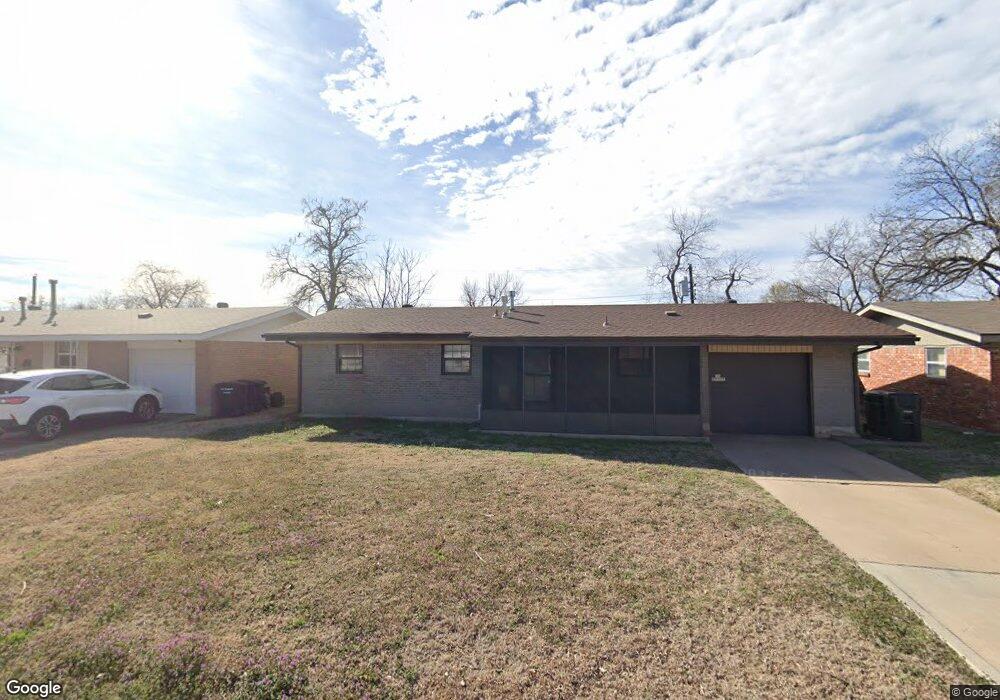
About This Home
This home is located at 632 SW 12th St, Moore, OK 73160 and is currently estimated at $139,334, approximately $152 per square foot. 632 SW 12th St is a home located in Cleveland County with nearby schools including Plaza Towers Elementary School, Highland West Junior High School, and Southmoore High School.
Ownership History
Date
Name
Owned For
Owner Type
Purchase Details
Closed on
Sep 25, 2020
Sold by
Quick Real Estate Solutions Llc
Bought by
Nguyen Sandy Hong
Current Estimated Value
Create a Home Valuation Report for This Property
The Home Valuation Report is an in-depth analysis detailing your home's value as well as a comparison with similar homes in the area
Home Values in the Area
Average Home Value in this Area
Purchase History
| Date | Buyer | Sale Price | Title Company |
|---|---|---|---|
| Nguyen Sandy Hong | $81,000 | Old Republic Title Co Of Ok |
Source: Public Records
Tax History
| Year | Tax Paid | Tax Assessment Tax Assessment Total Assessment is a certain percentage of the fair market value that is determined by local assessors to be the total taxable value of land and additions on the property. | Land | Improvement |
|---|---|---|---|---|
| 2025 | $1,384 | $11,303 | $2,695 | $8,608 |
| 2023 | $1,249 | $10,252 | $2,592 | $7,660 |
| 2022 | $1,207 | $9,764 | $2,419 | $7,345 |
| 2021 | $1,156 | $9,299 | $2,040 | $7,259 |
| 2020 | $926 | $8,447 | $1,853 | $6,594 |
| 2019 | $911 | $8,201 | $1,799 | $6,402 |
| 2018 | $882 | $7,963 | $1,747 | $6,216 |
| 2017 | $857 | $9,300 | $0 | $0 |
| 2016 | $834 | $7,505 | $1,646 | $5,859 |
| 2015 | $729 | $7,287 | $1,586 | $5,701 |
| 2014 | $721 | $7,075 | $864 | $6,211 |
Source: Public Records
Map
Nearby Homes
- 690 SW 12th St
- 779 SW 14th St
- 621 SW 7th St
- 1205 S Howard Ave
- 133 SW 14th St
- 132 SW 16th St
- 913 S Howard Ave
- 849 SW 10th St
- 117 SW 6th St
- 753 SW 4th Place
- 764 SW 3rd St
- 925 SW 14th St
- 924 SW 15th St
- 209 S Irving Dr
- 1105 Golden Leaf Dr
- 712 Penn Ln
- 502 Stoneridge Dr
- 401 SE 10th St
- 305 Golden Leaf Ct
- 947 SW 4th Place
Your Personal Tour Guide
Ask me questions while you tour the home.