

Estimated payment $3,283/month
Highlights
- Outdoor Fireplace
- Great Room
- No HOA
- Prune Hill Elementary School Rated A
- Private Yard
- Cottage
About This Home
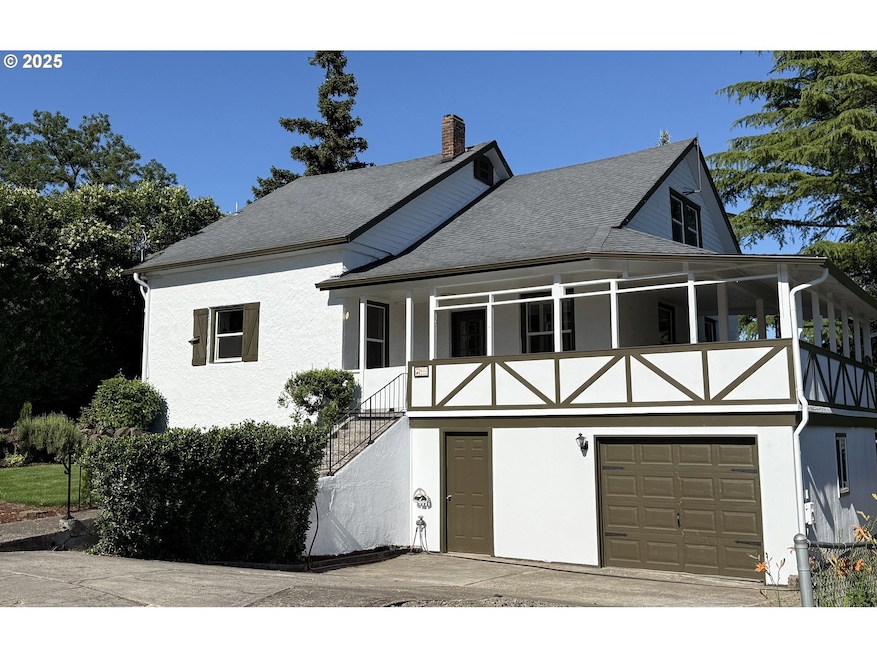
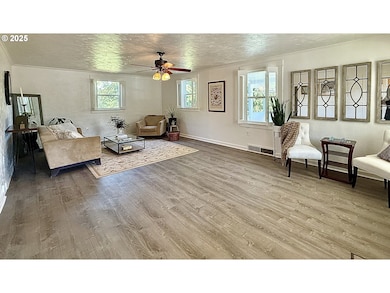
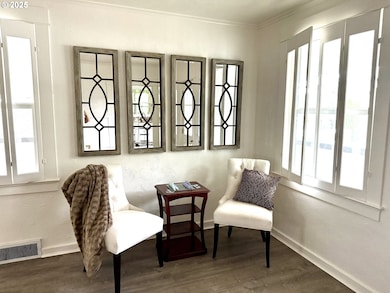
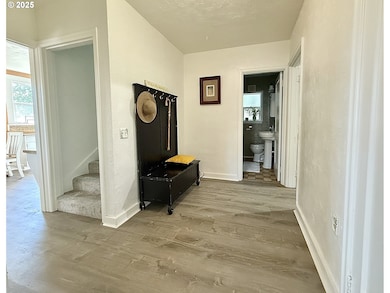
Welcome home to a one-of-a kind storybook 1927 Cottage; 4-bedroom, 2-bath lovingly restored, leaving the historical features intact. Originally a mill worker's home, it has a European country feel, with stucco and Tudor-style trim. Primary on main, bath with slipper clawfoot tub; upstairs 3 bedrooms, 2 with huge closets, new custom tiled shower in 2nd bath. Laundry chutes take your clothes all the way to the basement! Original interior "shutters" with curtain insets in living room, spacious hall with louvered storage. Enjoy your eat-in kitchen, original Washington Line cabinets made in Tacoma with copper handles. We kept the best of classic features and added NEW kitchen appliances! *NEW bathroom fixtures (upstairs.) *NEW windows through the entire home! *NEW LVP on main level and carpet upstairs. *NEW electrical panel. *NEW paint inside and out. *NEW gutters. Central heat/AC is modern and efficient, roof has years of life left. *380 SF covered porch with NEW outdoor carpet. Relax all year, listen to the birds sing, have morning coffee or watch the sunset with your loved ones. More features not found in new homes (you'll wonder why) *Root Cellar that can be used for storing food or your wine collection. *Laundry Room (we left it funky) leads to *Grow Room to help to with garden starts all year around. (You provide the lights and fixtures.) Space for storage, crafting, tools, hobbies, bicycles, a small boat. North side of home reminds you of a secret garden path with lovely rock-lined walk. Huge back yard has outdoor fireplace ready for your 'smores and fun (unless you want to convert to a pizza oven), a garden space, a horseshoe pit, tall trees, and is fully fenced. It's ready for you to put your custom touch or just relax and enjoy for now with BBQs and parties. Flat enough to add your badminton game. Quiet neighborhood, near hwy 14, less than 2 miles to historic downtown Camas. Camas schools are TOP RATED in the area.
Listing Agent
homecoin.com Brokerage Phone: 888-400-2513 License #201253274 Listed on: 06/29/2025
Home Details
Home Type
- Single Family
Est. Annual Taxes
- $4,538
Year Built
- Built in 1927
Lot Details
- 8,276 Sq Ft Lot
- Fenced
- Level Lot
- Landscaped with Trees
- Private Yard
- Garden
Parking
- 1 Car Attached Garage
- Workshop in Garage
- Controlled Entrance
Home Design
- Cottage
- Block Foundation
- Composition Roof
- Stucco Exterior
Interior Spaces
- 2,775 Sq Ft Home
- 1-Story Property
- Built-In Features
- Ceiling Fan
- Double Pane Windows
- Vinyl Clad Windows
- Great Room
- Family Room
- Living Room
- Dining Room
- Laundry Room
Kitchen
- Free-Standing Range
- Range Hood
- Plumbed For Ice Maker
- Dishwasher
- Stainless Steel Appliances
- ENERGY STAR Qualified Appliances
- Disposal
Flooring
- Concrete
- Vinyl
Bedrooms and Bathrooms
- 4 Bedrooms
Finished Basement
- Exterior Basement Entry
- Natural lighting in basement
Outdoor Features
- Covered Patio or Porch
- Outdoor Fireplace
Schools
- Prune Hill Elementary School
- Skyridge Middle School
- Camas High School
Utilities
- Central Air
- Heating System Uses Gas
- High Speed Internet
Additional Features
- Accessibility Features
- ENERGY STAR Qualified Equipment for Heating
Community Details
- No Home Owners Association
Listing and Financial Details
- Assessor Parcel Number 083910000
Map
Home Values in the Area
Average Home Value in this Area
Tax History
| Year | Tax Paid | Tax Assessment Tax Assessment Total Assessment is a certain percentage of the fair market value that is determined by local assessors to be the total taxable value of land and additions on the property. | Land | Improvement |
|---|---|---|---|---|
| 2025 | $4,538 | $384,911 | $96,101 | $288,810 |
| 2024 | $4,133 | $475,841 | $159,718 | $316,123 |
| 2023 | $4,494 | $465,713 | $155,174 | $310,539 |
| 2022 | $4,100 | $481,733 | $155,174 | $326,559 |
| 2021 | $4,052 | $367,438 | $116,549 | $250,889 |
| 2020 | $3,920 | $336,558 | $107,461 | $229,097 |
| 2019 | $3,799 | $301,953 | $96,101 | $205,852 |
| 2018 | $3,679 | $311,744 | $0 | $0 |
| 2017 | $3,242 | $253,748 | $0 | $0 |
| 2016 | $2,816 | $243,499 | $0 | $0 |
| 2015 | $2,697 | $210,387 | $0 | $0 |
| 2014 | -- | $190,014 | $0 | $0 |
| 2013 | -- | $171,025 | $0 | $0 |
Property History
| Date | Event | Price | Change | Sq Ft Price |
|---|---|---|---|---|
| 07/10/2025 07/10/25 | Pending | -- | -- | -- |
| 07/09/2025 07/09/25 | Off Market | $550,000 | -- | -- |
| 06/29/2025 06/29/25 | For Sale | $550,000 | -- | $198 / Sq Ft |
Purchase History
| Date | Type | Sale Price | Title Company |
|---|---|---|---|
| Warranty Deed | $208,719 | Cascade Title | |
| Warranty Deed | $123,500 | Clark County Title | |
| Trustee Deed | $109,446 | Chicago Title Insurance | |
| Warranty Deed | $27,500 | Chicago Title Insurance Co | |
| Warranty Deed | $106,600 | Chicago Title Insurance Co |
Mortgage History
| Date | Status | Loan Amount | Loan Type |
|---|---|---|---|
| Previous Owner | $185,000 | Unknown | |
| Previous Owner | $159,600 | Unknown | |
| Previous Owner | $117,300 | Purchase Money Mortgage | |
| Previous Owner | $107,560 | No Value Available |
Source: Regional Multiple Listing Service (RMLS)
MLS Number: 639080601
APN: 083910-000
Disclaimer: Certain information contained herein is derived from information provided by parties other than Homes.com. All information provided is deemed reliable, but is not guaranteed to be accurate and should be independently verified.
![]() The content relating to real estate for sale on this web site comes in part from the IDX program of the RMLS™ of Portland, Oregon. Real estate listings held by brokerage firms other than Ten-X are marked with the RMLS™ logo, and detailed information about these properties includes the names of the listing brokers. Listing content is copyright © 2025 RMLS™, Portland, Oregon. Some properties which appear for sale on this web site may subsequently have sold or may no longer be available. All information provided is deemed reliable but is not guaranteed and should be independently verified.
The content relating to real estate for sale on this web site comes in part from the IDX program of the RMLS™ of Portland, Oregon. Real estate listings held by brokerage firms other than Ten-X are marked with the RMLS™ logo, and detailed information about these properties includes the names of the listing brokers. Listing content is copyright © 2025 RMLS™, Portland, Oregon. Some properties which appear for sale on this web site may subsequently have sold or may no longer be available. All information provided is deemed reliable but is not guaranteed and should be independently verified.
- 2219 SW 6th Ave
- 2311 SW 6th Ave Unit 19
- 2311 SW 6th Ave Unit D2
- 2311 SW 6th Ave Unit 9
- 2229 NW 6th Place
- 2012 NW Sierra Ln
- 1938 NW Sierra Ln
- 2508 SW 6th Ave
- 630 SW Zillah St
- 1945 NW 7th Ave
- 645 NW Garden Ct Unit LOT 20
- 590 NW Garden Ct Unit LOT 24
- 630 NW Halifax St Unit Lot 15
- 682 NW Ct Unit Lot 26
- 645 NW Halifax St Unit Lot 7
- 0 NW Garden Ct Unit 24028974
- 0 NW Halifax Unit Lot 6 24459237
- 732 NW Garden Ct Unit Lot 27
- 667 NW Halifax St Unit LOT 8
- 501 NW Halifax St Unit LOT 3
