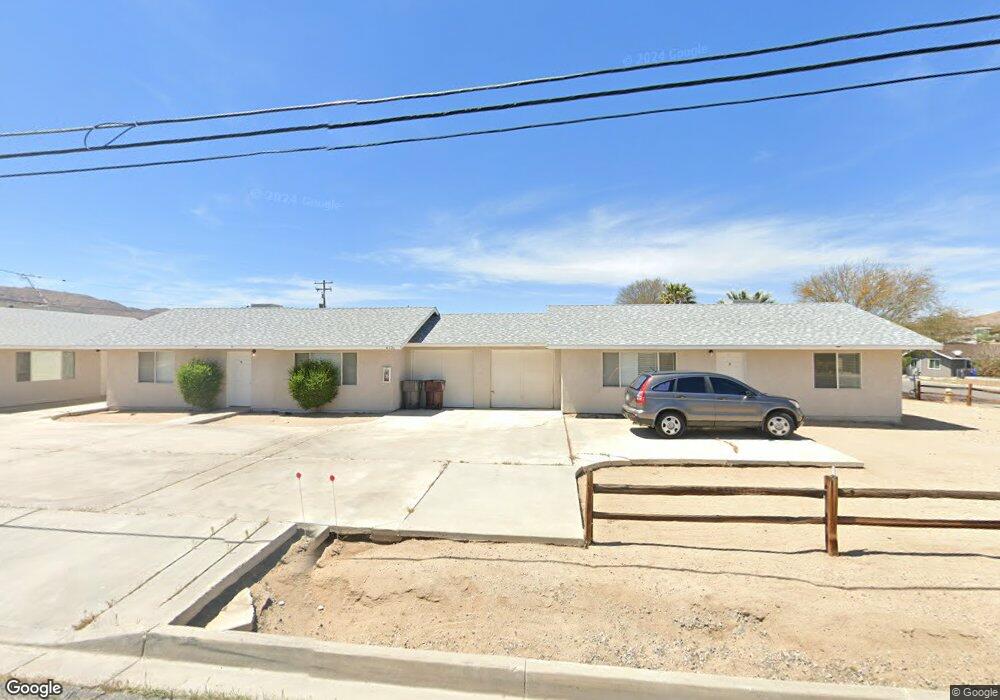
6320 El Reposo St Unit C Joshua Tree, CA 92252
Estimated Value: $379,000 - $606,000
2
Beds
2
Baths
2,835
Sq Ft
$174/Sq Ft
Est. Value
About This Home
This home is located at 6320 El Reposo St Unit C, Joshua Tree, CA 92252 and is currently estimated at $494,667, approximately $174 per square foot. 6320 El Reposo St Unit C is a home located in San Bernardino County with nearby schools including Joshua Tree Elementary School, La Contenta Middle School, and Yucca Valley High School.
Ownership History
Date
Name
Owned For
Owner Type
Purchase Details
Closed on
Feb 24, 2014
Sold by
Frazar Sally and Hopkins Wesley
Bought by
Hopkins Wesley G and Frazar Sally C
Current Estimated Value
Purchase Details
Closed on
Oct 19, 2012
Sold by
Onewest Bank Fsb
Bought by
Frazar Sally and Mcdowell Wayne
Purchase Details
Closed on
Jul 18, 2012
Sold by
Hobbs Robert J and Hobbs Jennifer L
Bought by
Onewest Bank Fsb
Purchase Details
Closed on
Feb 18, 2004
Sold by
Walker Richard D
Bought by
Hobbs Robert J and Hobbs Jennifer L
Home Financials for this Owner
Home Financials are based on the most recent Mortgage that was taken out on this home.
Original Mortgage
$144,000
Interest Rate
5.57%
Mortgage Type
Purchase Money Mortgage
Create a Home Valuation Report for This Property
The Home Valuation Report is an in-depth analysis detailing your home's value as well as a comparison with similar homes in the area
Home Values in the Area
Average Home Value in this Area
Purchase History
| Date | Buyer | Sale Price | Title Company |
|---|---|---|---|
| Hopkins Wesley G | -- | None Available | |
| Frazar Sally | $120,000 | Lsi Title Company | |
| Onewest Bank Fsb | $98,076 | None Available | |
| Hobbs Robert J | $180,000 | First American |
Source: Public Records
Mortgage History
| Date | Status | Borrower | Loan Amount |
|---|---|---|---|
| Previous Owner | Hobbs Robert J | $144,000 |
Source: Public Records
Tax History Compared to Growth
Tax History
| Year | Tax Paid | Tax Assessment Tax Assessment Total Assessment is a certain percentage of the fair market value that is determined by local assessors to be the total taxable value of land and additions on the property. | Land | Improvement |
|---|---|---|---|---|
| 2025 | $2,143 | $147,647 | $18,470 | $129,177 |
| 2024 | $2,143 | $144,752 | $18,108 | $126,644 |
| 2023 | $2,106 | $141,914 | $17,753 | $124,161 |
| 2022 | $2,068 | $139,131 | $17,405 | $121,726 |
| 2021 | $2,047 | $136,403 | $17,064 | $119,339 |
| 2020 | $2,031 | $135,004 | $16,889 | $118,115 |
| 2019 | $2,125 | $132,357 | $16,558 | $115,799 |
| 2018 | $1,948 | $129,761 | $16,233 | $113,528 |
| 2017 | $1,931 | $127,217 | $15,915 | $111,302 |
| 2016 | $1,903 | $124,723 | $15,603 | $109,120 |
| 2015 | $1,868 | $122,850 | $15,369 | $107,481 |
| 2014 | $1,885 | $120,444 | $15,068 | $105,376 |
Source: Public Records
Map
Nearby Homes
- 61850 Chollita Rd
- 61984 Commercial St
- 6394 Mountain View St
- 6426 Park Blvd
- 6435 Valley View St
- 61956 Aster Place
- 61959 Begonia Place
- 1234 29 Palms Hwy
- Hwy California 62
- 66262 29 Palms Hwy
- 66500 29 Palms Hwy
- 60750 29 Palms Hwy
- 1 29 Palms Hwy
- 0 E La Jolla Dr Unit MB24230601
- 6124 El Reposo St
- 0 Begonia Place Unit IV25254140
- 0 Valley View St Unit CV23078864
- 61720 Commercial St
- 6144 Panorama St
- 62060 Valley View Cir
- 6320 El Reposo St
- 61885 Verbena Rd Unit C
- 61885 Verbena Rd
- 6315 El Reposo St
- 61873 Verbena Rd
- 61872 Verbena Rd
- 61861 Verbena Rd
- 61888 Verbena Rd
- 61896 Verbena Rd Unit C
- 61896 Verbena Rd Unit D
- 61896 Verbena Rd
- 61930 Chollita Rd
- 61845 Verbena Rd
- 6297 El Reposo St
- 61933 Verbena Rd
- 61880 Verbena Rd Unit A
- 61880 Verbena Rd
- 61920 Verbena Rd
- 61941 Verbena Rd
- 61934 Verbena Rd