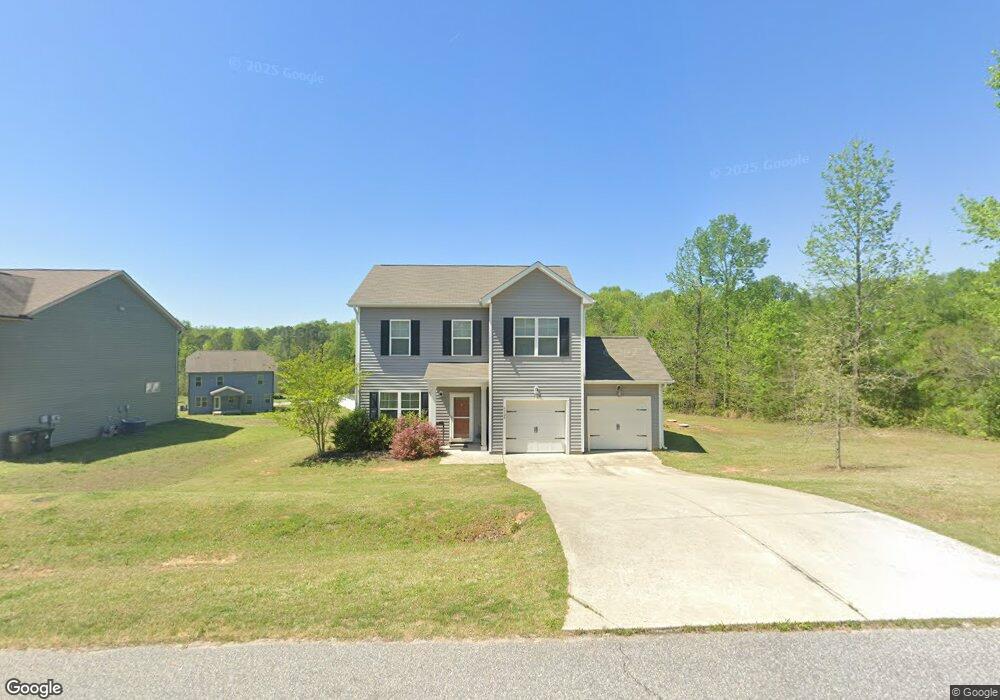
6320 Silver Creek Ln Raleigh, NC 27603
Estimated Value: $353,000 - $417,000
3
Beds
3
Baths
1,703
Sq Ft
$230/Sq Ft
Est. Value
About This Home
This home is located at 6320 Silver Creek Ln, Raleigh, NC 27603 and is currently estimated at $391,792, approximately $230 per square foot. 6320 Silver Creek Ln is a home with nearby schools including Rand Road Elementary, North Garner Middle, and Garner High.
Ownership History
Date
Name
Owned For
Owner Type
Purchase Details
Closed on
Feb 14, 2019
Sold by
Sullivan Matthew R and Sullivan Megan
Bought by
Sullivan Matthew R and Sullivan Megan
Current Estimated Value
Purchase Details
Closed on
Aug 30, 2017
Sold by
Avh Betghpage Llc
Bought by
Sullivan Matthew R and Bodner Megan E
Home Financials for this Owner
Home Financials are based on the most recent Mortgage that was taken out on this home.
Original Mortgage
$225,096
Outstanding Balance
$188,122
Interest Rate
3.93%
Mortgage Type
New Conventional
Estimated Equity
$203,670
Purchase Details
Closed on
Mar 20, 2017
Sold by
Savy Homes Llc
Bought by
Airlie Coroporation Inc
Home Financials for this Owner
Home Financials are based on the most recent Mortgage that was taken out on this home.
Original Mortgage
$150,000
Interest Rate
4.19%
Mortgage Type
Construction
Create a Home Valuation Report for This Property
The Home Valuation Report is an in-depth analysis detailing your home's value as well as a comparison with similar homes in the area
Home Values in the Area
Average Home Value in this Area
Purchase History
| Date | Buyer | Sale Price | Title Company |
|---|---|---|---|
| Sullivan Matthew R | -- | None Available | |
| Sullivan Matthew R | $223,000 | None Available | |
| Airlie Coroporation Inc | $47,500 | None Available |
Source: Public Records
Mortgage History
| Date | Status | Borrower | Loan Amount |
|---|---|---|---|
| Open | Sullivan Matthew R | $225,096 | |
| Previous Owner | Airlie Coroporation Inc | $150,000 |
Source: Public Records
Tax History Compared to Growth
Tax History
| Year | Tax Paid | Tax Assessment Tax Assessment Total Assessment is a certain percentage of the fair market value that is determined by local assessors to be the total taxable value of land and additions on the property. | Land | Improvement |
|---|---|---|---|---|
| 2025 | $2,451 | $380,110 | $95,000 | $285,110 |
| 2024 | $2,380 | $380,110 | $95,000 | $285,110 |
| 2023 | $1,842 | $233,674 | $50,000 | $183,674 |
| 2022 | $1,708 | $233,674 | $50,000 | $183,674 |
| 2021 | $1,662 | $233,674 | $50,000 | $183,674 |
| 2020 | $1,635 | $233,674 | $50,000 | $183,674 |
| 2019 | $1,501 | $181,352 | $38,000 | $143,352 |
| 2018 | $1,381 | $38,000 | $38,000 | $0 |
| 2017 | $270 | $38,000 | $38,000 | $0 |
Source: Public Records
Map
Nearby Homes
- 1021 Wintu Ct
- 6501 Rock Service Station Rd
- 6121 Catandpolly Ln
- 6600 Rock Service Station Rd
- 1017 Azalea Garden Cir
- 6313 Southern Charm Ln
- 1025 Azalea Garden Cir
- 1033 Azalea Garden Cir
- 1037 Azalea Garden Cir
- 6009 Swales Way
- 1041 Azalea Garden Cir
- 1045 Azalea Garden Cir
- 1053 Azalea Garden Cir
- 1057 Azalea Garden Cir
- 1061 Azalea Garden Cir
- 1065 Azalea Garden Cir
- 1069 Azalea Garden Cir
- 6109 Oak Passage Dr
- 1009 Feldmen Dr
- 1101 Robinfield Dr
- 1428 Yakimas Rd
- 1424 Yakimas Rd
- 6321 Silver Creek Ln
- 6325 Silver Creek Ln
- 6328 Silver Creek Ln
- 1001 Silver Farm Rd
- 1432 Yakimas Rd
- 1516 Yakimas Rd
- 1508 Yakimas Rd
- 1009 Silver Farm Rd
- 1429 Yakimas Rd
- 6204 Cotter Ridge Ct
- 1425 Yakimas Rd
- 6208 Cotter Ridge Ct
- 1000 Silver Farm Rd
- 1004 Silver Farm Rd
- 1509 Yakimas Rd
- 1421 Yakimas Rd
- 1008 Silver Farm Rd
- 6212 Cotter Ridge Ct