6320 Temple St Unit 15 Lithia Springs, GA 30122
Lithia Springs NeighborhoodEstimated Value: $248,000 - $274,072
3
Beds
1
Bath
1,920
Sq Ft
$137/Sq Ft
Est. Value
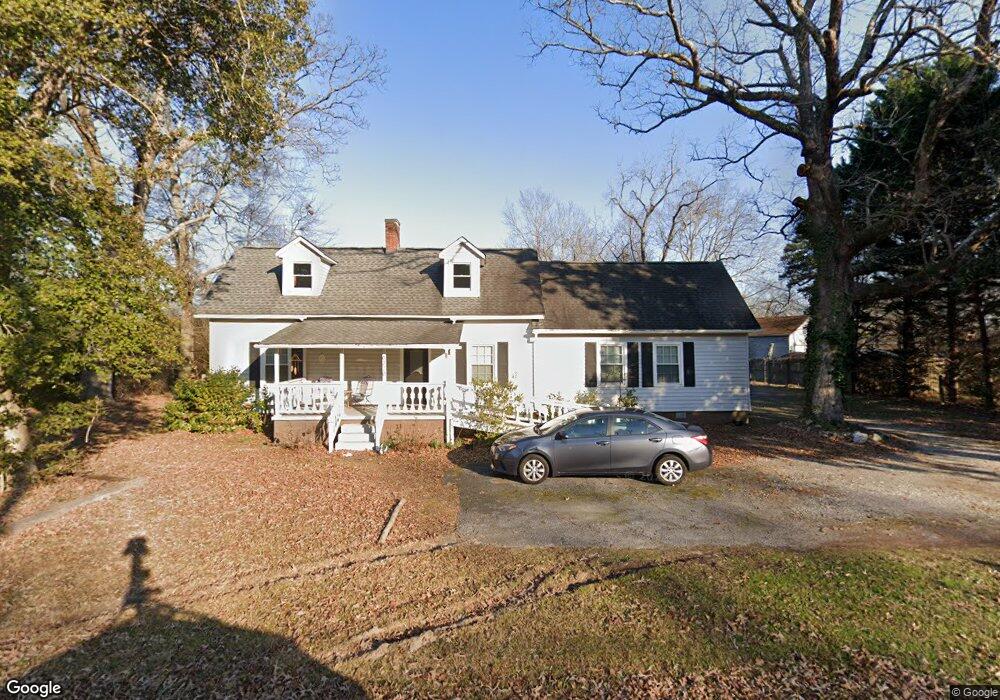
About This Home
This home is located at 6320 Temple St Unit 15, Lithia Springs, GA 30122 and is currently estimated at $263,768, approximately $137 per square foot. 6320 Temple St Unit 15 is a home located in Douglas County with nearby schools including Annette Winn Elementary School, Turner Middle School, and Lithia Springs Comprehensive High School.
Ownership History
Date
Name
Owned For
Owner Type
Purchase Details
Closed on
Apr 26, 2016
Sold by
S Nelson Family Llc
Bought by
Faller Katherine E
Current Estimated Value
Home Financials for this Owner
Home Financials are based on the most recent Mortgage that was taken out on this home.
Original Mortgage
$98,230
Interest Rate
3.71%
Mortgage Type
New Conventional
Purchase Details
Closed on
Dec 30, 2015
Sold by
Bracero Angel P
Bought by
S Nelson Family Llc
Purchase Details
Closed on
Dec 9, 2014
Sold by
Federal National Mtg Associati
Bought by
Resto Angel P and Bracero Martha M
Purchase Details
Closed on
Aug 5, 2014
Sold by
Toney Mary C
Bought by
Wells Fargo Bank Na
Purchase Details
Closed on
Oct 16, 1996
Sold by
Wadsworth John W Karen L
Bought by
Toney Mary C
Create a Home Valuation Report for This Property
The Home Valuation Report is an in-depth analysis detailing your home's value as well as a comparison with similar homes in the area
Home Values in the Area
Average Home Value in this Area
Purchase History
| Date | Buyer | Sale Price | Title Company |
|---|---|---|---|
| Faller Katherine E | $103,400 | -- | |
| S Nelson Family Llc | $50,000 | -- | |
| Resto Angel P | $19,000 | -- | |
| Wells Fargo Bank Na | $46,269 | -- | |
| Federal National Mtg Associati | $46,269 | -- | |
| Toney Mary C | $67,000 | -- |
Source: Public Records
Mortgage History
| Date | Status | Borrower | Loan Amount |
|---|---|---|---|
| Previous Owner | Faller Katherine E | $98,230 | |
| Closed | Toney Mary C | $0 |
Source: Public Records
Tax History Compared to Growth
Tax History
| Year | Tax Paid | Tax Assessment Tax Assessment Total Assessment is a certain percentage of the fair market value that is determined by local assessors to be the total taxable value of land and additions on the property. | Land | Improvement |
|---|---|---|---|---|
| 2024 | $2,828 | $89,880 | $14,000 | $75,880 |
| 2023 | $2,828 | $89,880 | $14,000 | $75,880 |
| 2022 | $1,883 | $57,840 | $8,000 | $49,840 |
| 2021 | $1,481 | $45,400 | $8,000 | $37,400 |
| 2020 | $1,506 | $45,400 | $8,000 | $37,400 |
| 2019 | $1,377 | $44,480 | $8,000 | $36,480 |
| 2017 | $1,158 | $36,520 | $5,680 | $30,840 |
| 2016 | $710 | $22,000 | $7,440 | $14,560 |
| 2015 | $250 | $7,600 | $2,783 | $4,817 |
| 2014 | $150 | $20,360 | $7,440 | $12,920 |
| 2013 | -- | $20,160 | $7,440 | $12,720 |
Source: Public Records
Map
Nearby Homes
- 6358 Gordon St
- 6419 Arthur Dr
- 6163 Temple St
- 6203 Temple St
- 3020 Ben Blvd
- 6471 Ansley Blvd
- 6531 Temple St
- 6503 Jackie Ln
- 6558 Boyd St
- 2030 Stonebrook Cir
- 6538 N Sweetwater Rd
- 3667 Humphries Hill Rd
- 3536 Perry Point
- 6230 Kensington Ct
- 6309 Wellington Way
- 325 Paces Dr
- 3705 Tate Place
- 6277 N Sweetwater Rd
- 6660 Maxwell Dr
- 3636 Perry Point
- 6320 Temple St
- 6304 Temple St
- 6292 Temple St
- 6323 Temple St
- 6335 Temple St
- 6307 Temple St
- 6352 Temple St
- 6280 Temple St
- 3507 Gordon St
- 6349 Temple St
- 6270 Temple St
- 3560 Strickland St
- 6354 Temple St
- 3560A Strickland St
- 0 Strickland St
- 6265 Temple St
- 0 Temple St Unit 7537137
- 0 Temple St Unit 8664830
- 0 Temple St Unit 7537562
- 0 Temple St Unit 3159404