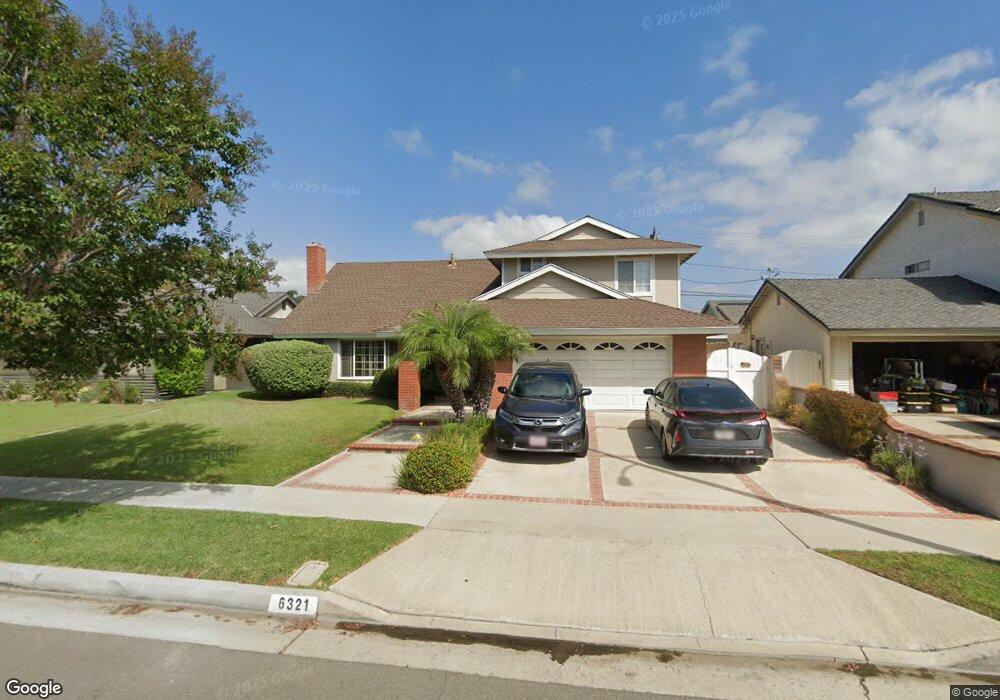
6321 Athena Dr Huntington Beach, CA 92647
Estimated Value: $1,534,581 - $1,745,000
5
Beds
3
Baths
2,476
Sq Ft
$660/Sq Ft
Est. Value
About This Home
This home is located at 6321 Athena Dr, Huntington Beach, CA 92647 and is currently estimated at $1,634,895, approximately $660 per square foot. 6321 Athena Dr is a home located in Orange County with nearby schools including Golden View Elementary School - Environmental Science School, Mesa View Middle School, and Ocean View High.
Ownership History
Date
Name
Owned For
Owner Type
Purchase Details
Closed on
Sep 9, 2010
Sold by
Montgomery Robert T and Montgomery Christine M
Bought by
Montgomery Robert T and Montgomery Christine M
Current Estimated Value
Home Financials for this Owner
Home Financials are based on the most recent Mortgage that was taken out on this home.
Original Mortgage
$244,000
Interest Rate
4.35%
Mortgage Type
New Conventional
Purchase Details
Closed on
Feb 27, 2008
Sold by
Montgomery Robert T and Montgomery Christine M
Bought by
Montgomery Robert T and Montgomery Christine M
Create a Home Valuation Report for This Property
The Home Valuation Report is an in-depth analysis detailing your home's value as well as a comparison with similar homes in the area
Home Values in the Area
Average Home Value in this Area
Purchase History
| Date | Buyer | Sale Price | Title Company |
|---|---|---|---|
| Montgomery Robert T | -- | Ticor Title Insurance | |
| Montgomery Robert T | -- | Ticor Title Insurance | |
| Montgomery Robert T | -- | None Available |
Source: Public Records
Mortgage History
| Date | Status | Borrower | Loan Amount |
|---|---|---|---|
| Closed | Montgomery Robert T | $244,000 |
Source: Public Records
Tax History Compared to Growth
Tax History
| Year | Tax Paid | Tax Assessment Tax Assessment Total Assessment is a certain percentage of the fair market value that is determined by local assessors to be the total taxable value of land and additions on the property. | Land | Improvement |
|---|---|---|---|---|
| 2025 | $5,769 | $507,950 | $333,014 | $174,936 |
| 2024 | $5,769 | $497,991 | $326,485 | $171,506 |
| 2023 | $5,636 | $488,227 | $320,083 | $168,144 |
| 2022 | $5,551 | $478,654 | $313,806 | $164,848 |
| 2021 | $5,449 | $469,269 | $307,653 | $161,616 |
| 2020 | $5,387 | $464,458 | $304,499 | $159,959 |
| 2019 | $5,294 | $455,351 | $298,528 | $156,823 |
| 2018 | $5,175 | $446,423 | $292,674 | $153,749 |
| 2017 | $5,091 | $437,670 | $286,935 | $150,735 |
| 2016 | $4,884 | $429,089 | $281,309 | $147,780 |
| 2015 | $4,808 | $422,644 | $277,083 | $145,561 |
| 2014 | $4,713 | $414,365 | $271,655 | $142,710 |
Source: Public Records
Map
Nearby Homes
- 17231 Lido Ln
- 17442 Coronado Ln
- 6600 Warner Ave Unit 102
- 6600 Warner Ave
- 6301 Warner Ave Unit 88
- 6301 Warner Ave Unit 40
- 6051 Summerdale Dr
- 6241 Warner Ave Unit 173
- 6611 Crista Palma Dr
- 6672 Sun Dr Unit B
- 16892 Limelight Cir Unit B
- 17612 Wrightwood Ln
- 6171 Kiser Dr
- 6351 Gloria Dr
- 17042 Twain Ln
- 6171 Gumm Dr
- 17301 Juniper Ln
- 17172 Berlin Ln
- 16722 Goldenwest St
- 16542 Los Verdes Ln
- 6301 Athena Dr
- 6331 Athena Dr
- 6322 Freeborn Dr
- 6332 Freeborn Dr
- 6302 Freeborn Dr
- 6291 Athena Dr
- 6341 Athena Dr
- 6342 Freeborn Dr
- 6292 Freeborn Dr
- 6322 Athena Dr
- 6332 Athena Dr
- 6281 Athena Dr
- 6351 Athena Dr
- 6292 Athena Dr
- 17271 Gurney Ln
- 6352 Freeborn Dr
- 6282 Freeborn Dr
- 17201 Erwin Ln
- 6282 Athena Dr
- 6361 Athena Dr