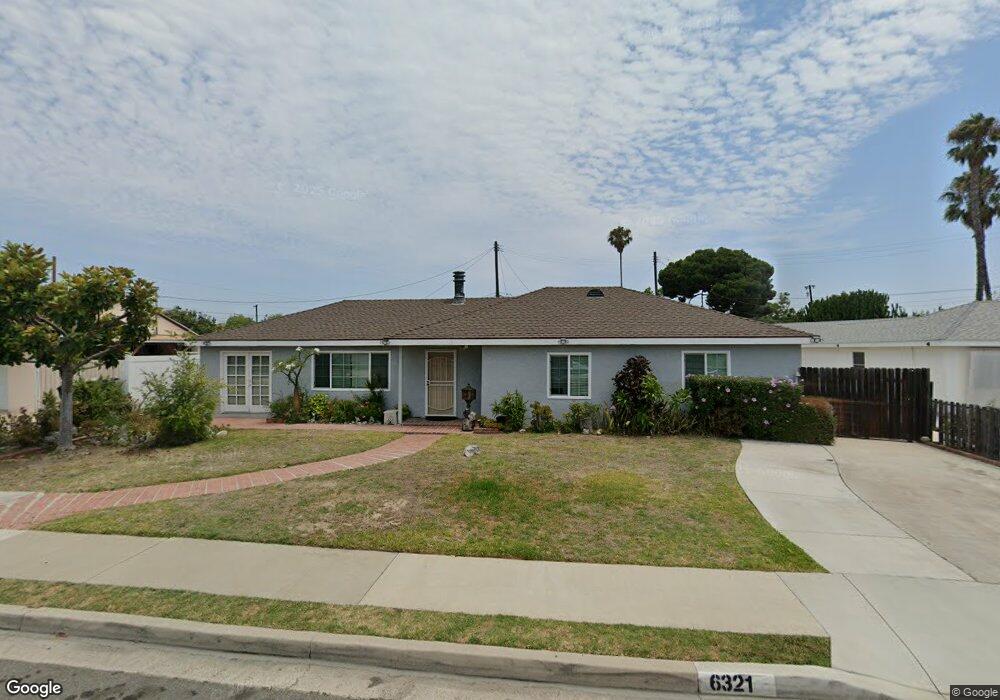
6321 Cayuga Dr Westminster, CA 92683
Estimated Value: $882,623 - $1,030,000
4
Beds
2
Baths
1,237
Sq Ft
$782/Sq Ft
Est. Value
About This Home
This home is located at 6321 Cayuga Dr, Westminster, CA 92683 and is currently estimated at $967,906, approximately $782 per square foot. 6321 Cayuga Dr is a home located in Orange County with nearby schools including Finley Elementary, Johnson Middle, and Westminster High School.
Ownership History
Date
Name
Owned For
Owner Type
Purchase Details
Closed on
Feb 9, 2013
Sold by
Do Phuong Hanh and Pham Cynthia
Bought by
Do Phuong Hanh and Pham Chuc Gia
Current Estimated Value
Home Financials for this Owner
Home Financials are based on the most recent Mortgage that was taken out on this home.
Original Mortgage
$205,950
Outstanding Balance
$144,502
Interest Rate
3.49%
Mortgage Type
New Conventional
Estimated Equity
$823,404
Purchase Details
Closed on
Mar 1, 2011
Sold by
Pham Chuc Gia and Do Phuong Hanh
Bought by
Do Phuong Hanh and Pham Cynthia
Purchase Details
Closed on
Jan 19, 2007
Sold by
Pham Chuc Gia and Do Phuong Hanh
Bought by
Pham Chuc Gia and Do Phuong Hanh
Purchase Details
Closed on
Jun 18, 1999
Sold by
Robert Beauchamp and Robert Sandra K
Bought by
Pham Chuc Gia and Do Phuong Hanh
Home Financials for this Owner
Home Financials are based on the most recent Mortgage that was taken out on this home.
Original Mortgage
$90,000
Interest Rate
7.51%
Create a Home Valuation Report for This Property
The Home Valuation Report is an in-depth analysis detailing your home's value as well as a comparison with similar homes in the area
Home Values in the Area
Average Home Value in this Area
Purchase History
| Date | Buyer | Sale Price | Title Company |
|---|---|---|---|
| Do Phuong Hanh | -- | None Available | |
| Do Phuong Hanh | -- | None Available | |
| Pham Chuc Gia | -- | Accommodation | |
| Pham Chuc Gia | $230,000 | First American Title Ins Co |
Source: Public Records
Mortgage History
| Date | Status | Borrower | Loan Amount |
|---|---|---|---|
| Open | Do Phuong Hanh | $205,950 | |
| Closed | Pham Chuc Gia | $90,000 |
Source: Public Records
Tax History
| Year | Tax Paid | Tax Assessment Tax Assessment Total Assessment is a certain percentage of the fair market value that is determined by local assessors to be the total taxable value of land and additions on the property. | Land | Improvement |
|---|---|---|---|---|
| 2025 | $4,549 | $353,495 | $259,671 | $93,824 |
| 2024 | $4,549 | $346,564 | $254,579 | $91,985 |
| 2023 | $4,396 | $339,769 | $249,587 | $90,182 |
| 2022 | $4,325 | $333,107 | $244,693 | $88,414 |
| 2021 | $4,215 | $326,576 | $239,895 | $86,681 |
| 2020 | $4,168 | $323,228 | $237,435 | $85,793 |
| 2019 | $4,124 | $316,891 | $232,780 | $84,111 |
| 2018 | $4,123 | $310,678 | $228,216 | $82,462 |
| 2017 | $3,976 | $304,587 | $223,741 | $80,846 |
| 2016 | $3,858 | $298,615 | $219,354 | $79,261 |
| 2015 | $3,795 | $294,130 | $216,059 | $78,071 |
| 2014 | $3,714 | $288,369 | $211,827 | $76,542 |
Source: Public Records
Map
Nearby Homes
- 6282 Cheyenne Dr
- 13036 Springarden Ln
- 6071 Modoc Rd
- 6091 Navajo Rd
- 6751 Klondike Ave
- 6122 Anthony Ave
- 6216 Hefley St Unit 3
- 5701 Norma Dr
- 6949 Danvers Dr
- 6691 Killarney Ave
- 6848 Citriadora Ct
- 6141 Trinette Ave
- 12552 Fieldstone Ln Unit 101
- 6971 Knollcrest Ln Unit 47
- 6952 Brightwood Ln Unit 3
- 5382 Laverne Cir
- 6052 Mahogany Ave
- 14101 Rondeau St
- 5302 Clark Cir
- 13731 Claremont St
Your Personal Tour Guide
Ask me questions while you tour the home.