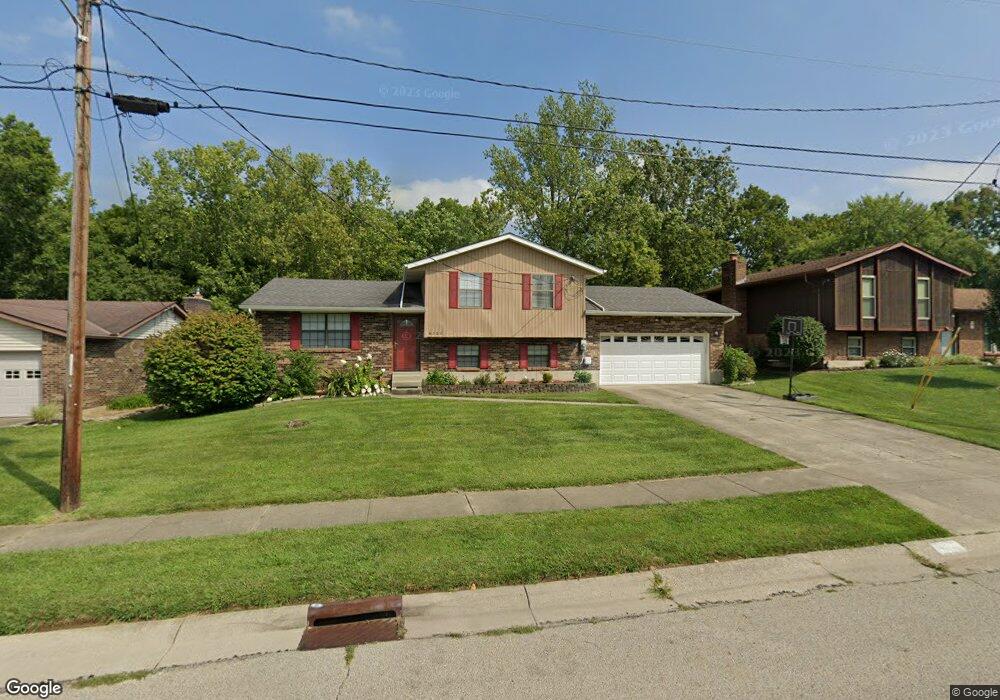
6322 Greenbriar Dr Fairfield, OH 45014
Estimated Value: $281,672 - $310,000
3
Beds
3
Baths
1,120
Sq Ft
$269/Sq Ft
Est. Value
About This Home
This home is located at 6322 Greenbriar Dr, Fairfield, OH 45014 and is currently estimated at $301,418, approximately $269 per square foot. 6322 Greenbriar Dr is a home located in Butler County with nearby schools including South Elementary School, Creekside Middle School, and Fairfield Senior High School.
Ownership History
Date
Name
Owned For
Owner Type
Purchase Details
Closed on
Jun 10, 2006
Sold by
Seidel Lance E and Seidel Kristen A
Bought by
Tolbert Dale A and Tolbert Karla R
Current Estimated Value
Home Financials for this Owner
Home Financials are based on the most recent Mortgage that was taken out on this home.
Original Mortgage
$163,100
Outstanding Balance
$96,692
Interest Rate
6.72%
Mortgage Type
Purchase Money Mortgage
Estimated Equity
$204,726
Purchase Details
Closed on
Jun 30, 1999
Sold by
Kent Bashor Hubert and Kent Lois A
Bought by
Seidel Lance E and Siedel Kristen A
Home Financials for this Owner
Home Financials are based on the most recent Mortgage that was taken out on this home.
Original Mortgage
$128,520
Interest Rate
7.54%
Mortgage Type
VA
Purchase Details
Closed on
Sep 1, 1991
Purchase Details
Closed on
Feb 1, 1986
Purchase Details
Closed on
Dec 1, 1985
Create a Home Valuation Report for This Property
The Home Valuation Report is an in-depth analysis detailing your home's value as well as a comparison with similar homes in the area
Home Values in the Area
Average Home Value in this Area
Purchase History
| Date | Buyer | Sale Price | Title Company |
|---|---|---|---|
| Tolbert Dale A | $164,000 | Landamerica | |
| Seidel Lance E | $126,000 | -- | |
| -- | $96,500 | -- | |
| -- | $74,900 | -- | |
| -- | $15,500 | -- |
Source: Public Records
Mortgage History
| Date | Status | Borrower | Loan Amount |
|---|---|---|---|
| Open | Tolbert Dale A | $163,100 | |
| Previous Owner | Seidel Lance E | $128,520 |
Source: Public Records
Tax History Compared to Growth
Tax History
| Year | Tax Paid | Tax Assessment Tax Assessment Total Assessment is a certain percentage of the fair market value that is determined by local assessors to be the total taxable value of land and additions on the property. | Land | Improvement |
|---|---|---|---|---|
| 2024 | $2,982 | $80,960 | $11,780 | $69,180 |
| 2023 | $2,968 | $84,710 | $11,780 | $72,930 |
| 2022 | $2,817 | $59,030 | $11,780 | $47,250 |
| 2021 | $2,437 | $58,110 | $11,780 | $46,330 |
| 2020 | $2,535 | $58,110 | $11,780 | $46,330 |
| 2019 | $4,209 | $48,750 | $11,400 | $37,350 |
| 2018 | $2,416 | $48,750 | $11,400 | $37,350 |
| 2017 | $2,440 | $48,750 | $11,400 | $37,350 |
| 2016 | $2,383 | $45,340 | $11,400 | $33,940 |
| 2015 | $2,269 | $45,340 | $11,400 | $33,940 |
| 2014 | $2,142 | $45,340 | $11,400 | $33,940 |
| 2013 | $2,142 | $44,920 | $11,400 | $33,520 |
Source: Public Records
Map
Nearby Homes
- 1 Pinehurst Ct
- 1777 Doral Dr
- 12057 Brookway Dr
- 2200 Augusta Blvd Unit 122
- 12181 Regency Run Ct
- 12070 Regency Run Ct
- 12120 Regency Run Ct
- 12080 Regency Run Ct Unit 4
- 12052 Doe Run Ct
- 1923 Centerbrook Ct
- 2047 Woodtrail Dr
- 27 Carousel Cir
- 5978 Morningside Dr
- 5986 Ricky Dr
- 1515 Gelhot Dr
- 46 Carousel Cir
- 2050 Woodtrail Dr
- 1535 Gelhot Dr
- 2 Dusk Ct Unit H2
- 32 Dusk Ct
- 6314 Greenbriar Dr
- 6330 Greenbriar Dr
- 6306 Greenbriar Dr
- 6338 Greenbriar Dr
- 6333 Greenbriar Dr
- 1898 Doral Dr
- 6298 Greenbriar Dr
- 6309 Greenbriar Dr
- 6346 Greenbriar Dr
- 5468 Polo Woods Ct
- 1895 Doral Dr
- 6301 Greenbriar Dr
- 6288 Greenbriar Dr
- 6341 Greenbriar Dr
- 6354 Greenbriar Dr
- 5460 Polo Woods Ct
- 1888 Doral Dr
- 1889 Doral Dr
- 6291 Greenbriar Dr
- 2007 Spyglass Hill Ct