Estimated Value: $516,000 - $752,000
3
Beds
2
Baths
1,138
Sq Ft
$577/Sq Ft
Est. Value
About This Home
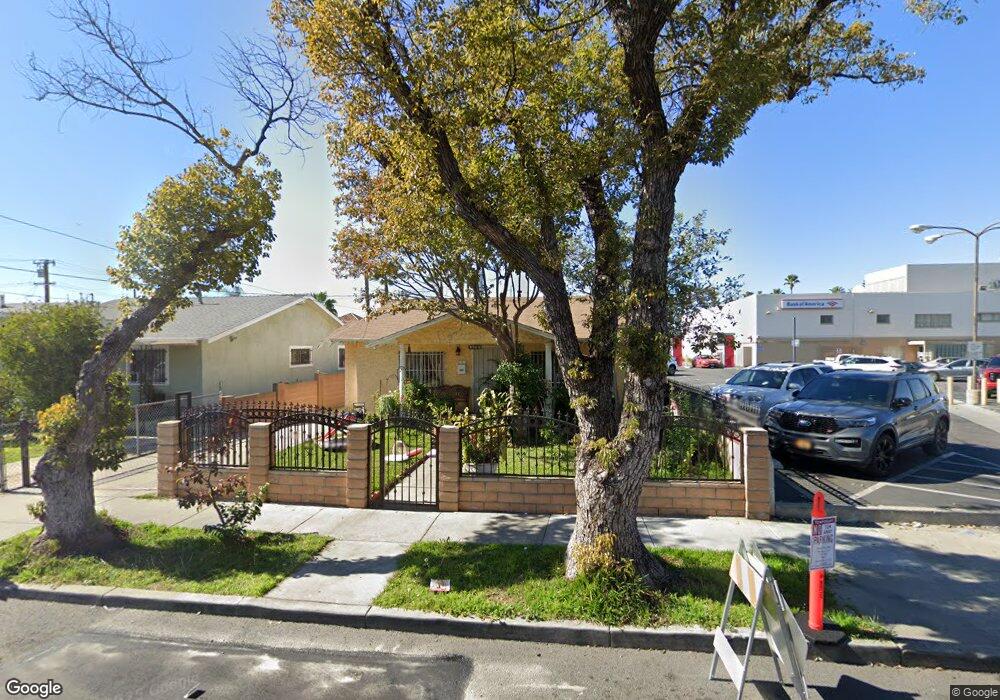
This home is located at 6323 Woodward Ave, Bell, CA 90201 and is currently estimated at $656,902, approximately $577 per square foot. 6323 Woodward Ave is a home located in Los Angeles County with nearby schools including Nueva Vista Elementary School, Chester W. Nimitz Middle School, and Maywood Academy High School.
Ownership History
Date
Name
Owned For
Owner Type
Purchase Details
Closed on
Oct 4, 2018
Sold by
Aguilar Gerard
Bought by
Perez Bialina Franco and The Aguilar Franco Living Trus
Current Estimated Value
Purchase Details
Closed on
May 22, 2014
Sold by
Aguilar Jose
Bought by
Aguilar Gerardo
Home Financials for this Owner
Home Financials are based on the most recent Mortgage that was taken out on this home.
Original Mortgage
$214,000
Outstanding Balance
$162,481
Interest Rate
4.23%
Mortgage Type
New Conventional
Estimated Equity
$494,421
Purchase Details
Closed on
May 12, 2010
Sold by
Espinosa Laura
Bought by
Aguilar Gerardo and Aguilar Jose
Home Financials for this Owner
Home Financials are based on the most recent Mortgage that was taken out on this home.
Original Mortgage
$219,780
Interest Rate
5.25%
Mortgage Type
FHA
Purchase Details
Closed on
Mar 2, 1995
Sold by
Espinosa Jose Luis and Espinosa Laura
Bought by
Espinosa Laura
Create a Home Valuation Report for This Property
The Home Valuation Report is an in-depth analysis detailing your home's value as well as a comparison with similar homes in the area
Home Values in the Area
Average Home Value in this Area
Purchase History
| Date | Buyer | Sale Price | Title Company |
|---|---|---|---|
| Perez Bialina Franco | -- | None Available | |
| Aguilar Gerardo | -- | Stewart Title | |
| Aguilar Gerardo | $240,000 | Fidelity National Title Co | |
| Espinosa Laura | -- | -- |
Source: Public Records
Mortgage History
| Date | Status | Borrower | Loan Amount |
|---|---|---|---|
| Open | Aguilar Gerardo | $214,000 | |
| Closed | Aguilar Gerardo | $219,780 |
Source: Public Records
Tax History
| Year | Tax Paid | Tax Assessment Tax Assessment Total Assessment is a certain percentage of the fair market value that is determined by local assessors to be the total taxable value of land and additions on the property. | Land | Improvement |
|---|---|---|---|---|
| 2025 | $6,843 | $435,049 | $334,654 | $100,395 |
| 2024 | $6,843 | $426,520 | $328,093 | $98,427 |
| 2023 | $6,721 | $418,158 | $321,660 | $96,498 |
| 2022 | $6,455 | $409,959 | $315,353 | $94,606 |
| 2021 | $6,392 | $401,921 | $309,170 | $92,751 |
| 2020 | $6,420 | $397,800 | $306,000 | $91,800 |
| 2019 | $6,200 | $390,000 | $300,000 | $90,000 |
| 2018 | $5,099 | $315,509 | $205,008 | $110,501 |
| 2016 | $5,019 | $303,260 | $197,049 | $106,211 |
| 2015 | $4,940 | $298,706 | $194,090 | $104,616 |
| 2014 | $4,307 | $252,714 | $164,580 | $88,134 |
Source: Public Records
Map
Nearby Homes
- 6509 Prospect Ave
- 6048 King Ave
- 6600 Fishburn Ave
- 4860 Bell Ave
- 4026 Gage Ave
- 4301 E 60th St
- 6152 Wilcox Ave
- 7025 Vinevale Ave
- 6122 Wilcox Ave
- 6800 Wilcox Ave
- 6901 Wilcox Ave
- 6522 Bear Ave
- 4940 Beck Ave
- 5824 Heliotrope Ave
- 4212 E 58th St
- 6011 Bear Ave
- 4957 E 59th Place
- 4101 E 57th St
- 4812 Live Oak St
- 4255 Clara St Unit B
- 6329 Woodward Ave
- 6331 Woodward Ave
- 6335 Woodward Ave
- 6320 Atlantic Ave
- 6322 Woodward Ave
- 6328 Woodward Ave
- 6316 Woodward Ave
- 6330 Woodward Ave
- 6338 Atlantic Ave
- 6340 Atlantic Ave
- 6310 Woodward Ave
- 6336 Woodward Ave
- 6340 Woodward Ave
- 6351 Atlantic Ave
- 6300 Woodward Ave
- 6349 Atlantic Ave
- 6325 King Ave
- 4523 Gage Ave
- 6319 King Ave
- 6329 King Ave
Your Personal Tour Guide
Ask me questions while you tour the home.