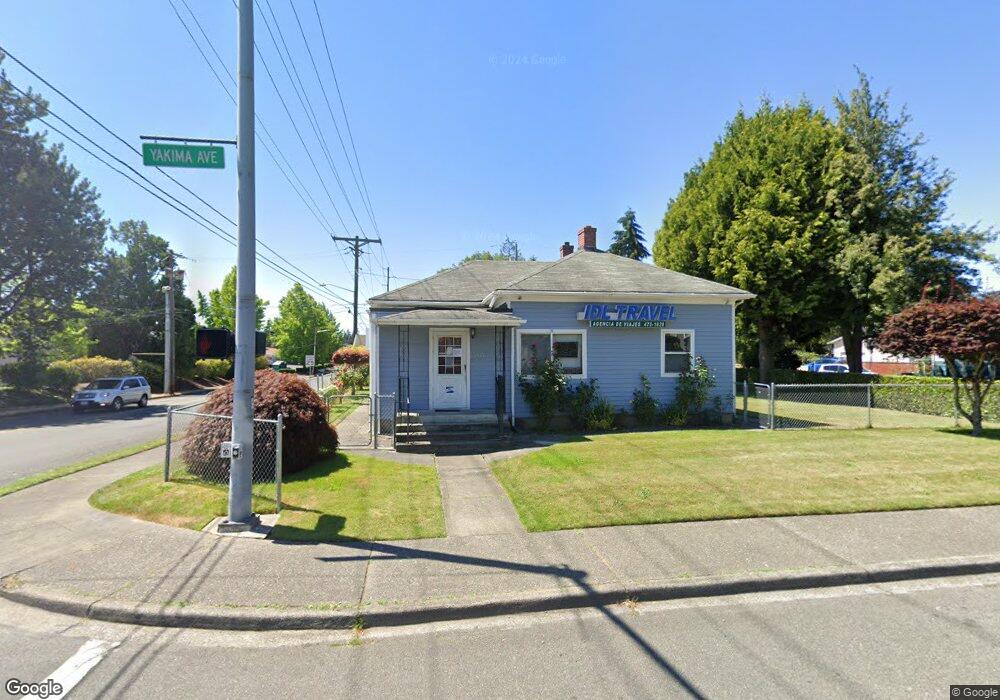
6324 S Yakima Ave Tacoma, WA 98408
South End NeighborhoodEstimated Value: $511,070 - $532,000
2
Beds
2
Baths
1,926
Sq Ft
$271/Sq Ft
Est. Value
About This Home
This home is located at 6324 S Yakima Ave, Tacoma, WA 98408 and is currently estimated at $522,518, approximately $271 per square foot. 6324 S Yakima Ave is a home located in Pierce County with nearby schools including Oakland High School, Angelo Giaudrone Middle School, and Mount Tahoma High School.
Ownership History
Date
Name
Owned For
Owner Type
Purchase Details
Closed on
Nov 10, 2005
Sold by
Hernandez Evelin Y
Bought by
Delgado Ismael
Current Estimated Value
Home Financials for this Owner
Home Financials are based on the most recent Mortgage that was taken out on this home.
Original Mortgage
$58,800
Interest Rate
6.14%
Mortgage Type
Stand Alone Second
Purchase Details
Closed on
Nov 1, 2005
Sold by
Pham Phan
Bought by
Delgado Ismael
Home Financials for this Owner
Home Financials are based on the most recent Mortgage that was taken out on this home.
Original Mortgage
$58,800
Interest Rate
6.14%
Mortgage Type
Stand Alone Second
Purchase Details
Closed on
Aug 4, 1995
Sold by
Bradley Ethyl L and Bradley Lorraine E
Bought by
Pham Phan and Huynh Trinh Tm
Home Financials for this Owner
Home Financials are based on the most recent Mortgage that was taken out on this home.
Original Mortgage
$71,550
Interest Rate
7.63%
Create a Home Valuation Report for This Property
The Home Valuation Report is an in-depth analysis detailing your home's value as well as a comparison with similar homes in the area
Home Values in the Area
Average Home Value in this Area
Purchase History
| Date | Buyer | Sale Price | Title Company |
|---|---|---|---|
| Delgado Ismael | -- | First American Title Ins Co | |
| Delgado Ismael | $294,000 | First American Title Ins Co | |
| Pham Phan | $79,500 | Commonwelath Title Company |
Source: Public Records
Mortgage History
| Date | Status | Borrower | Loan Amount |
|---|---|---|---|
| Closed | Delgado Ismael | $58,800 | |
| Open | Delgado Ismael | $235,200 | |
| Previous Owner | Pham Phan | $71,550 |
Source: Public Records
Tax History Compared to Growth
Tax History
| Year | Tax Paid | Tax Assessment Tax Assessment Total Assessment is a certain percentage of the fair market value that is determined by local assessors to be the total taxable value of land and additions on the property. | Land | Improvement |
|---|---|---|---|---|
| 2025 | $4,873 | $488,000 | $218,600 | $269,400 |
| 2024 | $4,873 | $477,900 | $211,100 | $266,800 |
| 2023 | $4,873 | $437,700 | $197,900 | $239,800 |
| 2022 | $4,656 | $483,000 | $198,000 | $285,000 |
| 2021 | $4,250 | $338,100 | $115,000 | $223,100 |
| 2019 | $3,654 | $311,600 | $96,200 | $215,400 |
| 2018 | $3,776 | $281,100 | $80,100 | $201,000 |
| 2017 | $3,290 | $239,000 | $65,400 | $173,600 |
| 2016 | $2,882 | $183,100 | $49,100 | $134,000 |
| 2014 | $2,633 | $165,700 | $43,800 | $121,900 |
| 2013 | $2,633 | $150,700 | $41,200 | $109,500 |
Source: Public Records
Map
Nearby Homes
- 6324 Yakima Ave
- 6320 Yakima Ave
- 6320 S Yakima Ave
- 6316 Yakima Ave
- 815 S 64th St
- 6402 Yakima Ave
- 819 S 64th St
- 6323 S Yakima Ave
- 6314 Yakima Ave
- 6323 Yakima Ave
- 6323 S Thompson Ave
- 6321 Yakima Ave
- 6317 S Thompson Ave
- 6319 S Yakima Ave
- 6319 Yakima Ave
- 6312 Yakima Ave
- 768 S 64th St
- 6313 S Thompson Ave
- 6315 Yakima Ave
- 6309 S Thompson Ave