6326 Amanda Oaks Cir N Memphis, TN 38141
Hickory Hill NeighborhoodEstimated Value: $156,000 - $175,000
3
Beds
3
Baths
1,602
Sq Ft
$100/Sq Ft
Est. Value
About This Home
This home is located at 6326 Amanda Oaks Cir N, Memphis, TN 38141 and is currently estimated at $160,909, approximately $100 per square foot. 6326 Amanda Oaks Cir N is a home located in Shelby County with nearby schools including Crump Elementary School, Kirby High School, and Memphis School of Excellence.
Ownership History
Date
Name
Owned For
Owner Type
Purchase Details
Closed on
Nov 20, 2015
Sold by
Equity Trust Co
Bought by
Equity Trust Co and Michael E Schinzel
Current Estimated Value
Purchase Details
Closed on
Nov 15, 2014
Sold by
Equity Trust Co
Bought by
Equity Trust Co and Michael E Schinzel Ira
Purchase Details
Closed on
Nov 8, 2011
Sold by
Memphis Invest Gp
Bought by
Equity Trust Company and Michael E Schenzel Ira
Purchase Details
Closed on
May 19, 2011
Sold by
The Secretary Of Housing & Urban Develop
Bought by
Memphis Invest Gp
Purchase Details
Closed on
Dec 5, 2008
Sold by
Smith William
Bought by
Secretary Of Housing & Urban Development
Purchase Details
Closed on
Dec 21, 2007
Sold by
Hill James S and Hill Juanita C
Bought by
Smith William
Home Financials for this Owner
Home Financials are based on the most recent Mortgage that was taken out on this home.
Original Mortgage
$96,239
Interest Rate
6.15%
Mortgage Type
FHA
Create a Home Valuation Report for This Property
The Home Valuation Report is an in-depth analysis detailing your home's value as well as a comparison with similar homes in the area
Home Values in the Area
Average Home Value in this Area
Purchase History
| Date | Buyer | Sale Price | Title Company |
|---|---|---|---|
| Equity Trust Co | -- | Attorney | |
| Equity Trust Co | -- | None Available | |
| Equity Trust Company | $82,500 | None Available | |
| Memphis Invest Gp | $45,900 | None Available | |
| Secretary Of Housing & Urban Development | $107,420 | None Available | |
| Smith William | $97,000 | Preferred Title & Escrow Llc |
Source: Public Records
Mortgage History
| Date | Status | Borrower | Loan Amount |
|---|---|---|---|
| Previous Owner | Smith William | $96,239 |
Source: Public Records
Tax History Compared to Growth
Tax History
| Year | Tax Paid | Tax Assessment Tax Assessment Total Assessment is a certain percentage of the fair market value that is determined by local assessors to be the total taxable value of land and additions on the property. | Land | Improvement |
|---|---|---|---|---|
| 2025 | $917 | $34,975 | $4,625 | $30,350 |
| 2024 | $917 | $27,050 | $3,500 | $23,550 |
| 2023 | $1,648 | $27,050 | $3,500 | $23,550 |
| 2022 | $1,648 | $27,050 | $3,500 | $23,550 |
| 2021 | $1,667 | $27,050 | $3,500 | $23,550 |
| 2020 | $1,293 | $17,850 | $3,500 | $14,350 |
| 2019 | $1,293 | $17,850 | $3,500 | $14,350 |
| 2018 | $1,293 | $17,850 | $3,500 | $14,350 |
| 2017 | $734 | $17,850 | $3,500 | $14,350 |
| 2016 | $741 | $16,950 | $0 | $0 |
| 2014 | $741 | $16,950 | $0 | $0 |
Source: Public Records
Map
Nearby Homes
- 4585 S Berrypick Ln
- 6481 Summer Creek E
- 6493 Summer Creek E
- 6167 Afternoon Ln
- 4463 Sandy Park Dr
- 6395 Golden Park Dr
- 4579 Blue Willow Rd
- 4567 Crump Rd
- 0 Sunnyslope Dr
- 6543 Stockport Dr
- 4821 Blue Wing St
- 6043 Harvest Hill Cove
- 6080 Scarlet Leaf Dr
- 6043 Tall Willow Dr
- 6623 Quail Covey Dr
- 6184 Holly Park Dr
- 6577 Beaverlodge Dr
- 4343 Deergrove Rd
- 4451 Broad Creek Cove
- 4325 Willow Park Cove
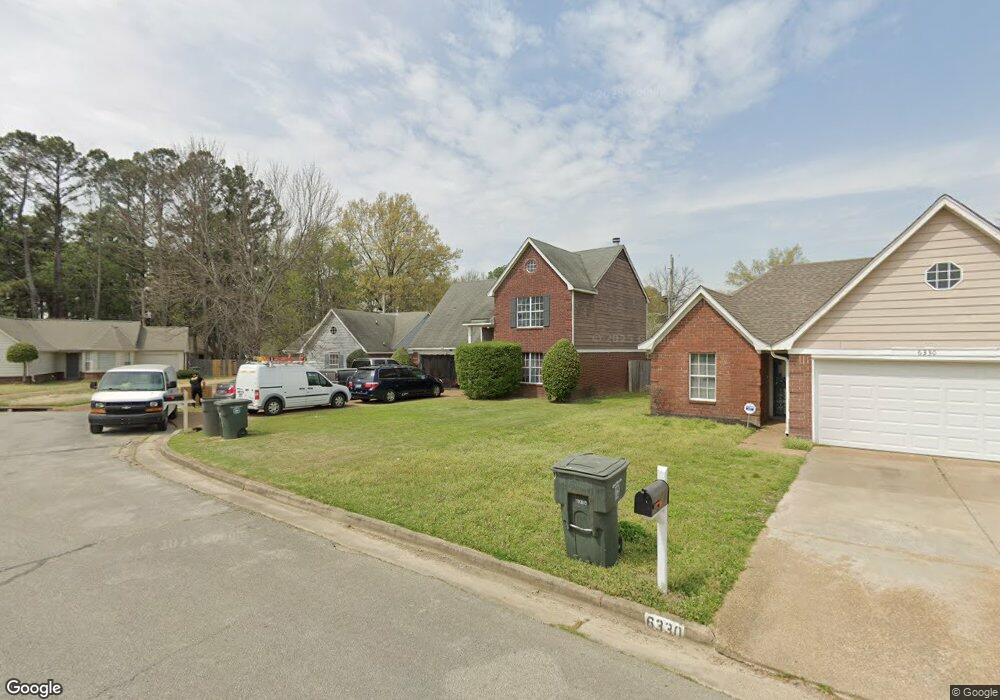
- 6330 Amanda Oaks Cir N
- 6320 Amanda Oaks Cir N
- 6336 Amanda Oaks Cir N
- 6323 Berrypick Ln
- 6317 Berrypick Ln
- 6335 Berrypick Ln
- 6340 Amanda Oaks Cir N
- 4643 Amanda Oaks Cir W
- 6327 Amanda Oaks Cir N
- 6333 Amanda Oaks Cir N
- 6311 Berrypick Ln
- 4647 Amanda Oaks Cir W
- 6341 Berrypick Ln
- 6337 Amanda Oaks Cir N
- 6346 Amanda Oaks Cir N
- 4651 Amanda Oaks Cir W
- 4630 Sandy Park Dr
- 4636 Sandy Park Dr
- 6343 Amanda Oaks Cir N
- 6347 Berrypick Ln