6329 Macon Rd Memphis, TN 38134
Cordova NeighborhoodEstimated Value: $148,000 - $196,000
3
Beds
1
Bath
1,480
Sq Ft
$120/Sq Ft
Est. Value
About This Home
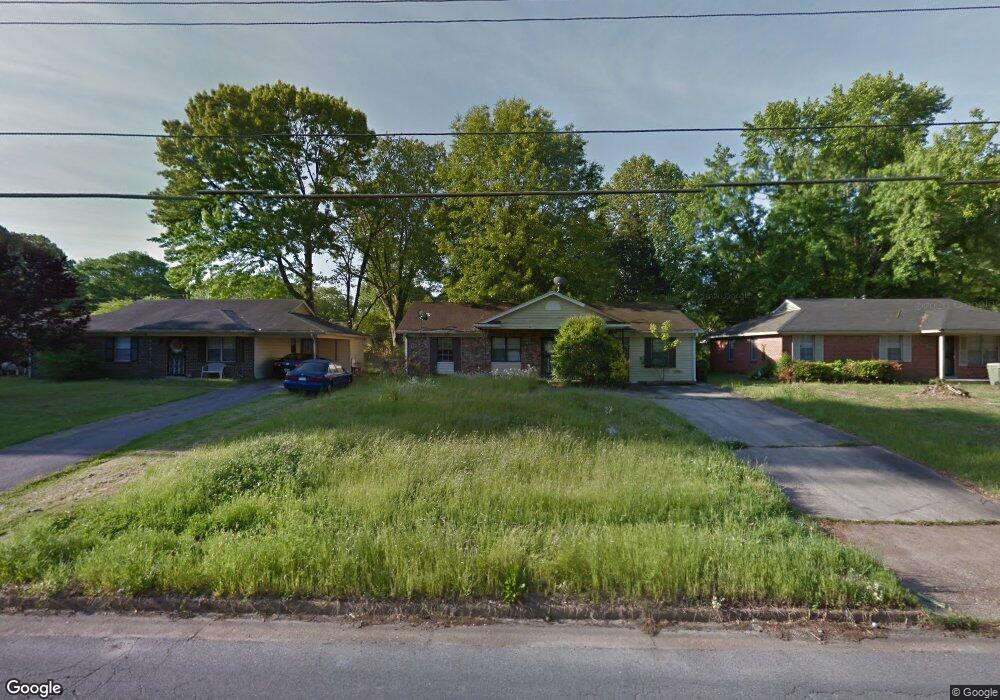
This home is located at 6329 Macon Rd, Memphis, TN 38134 and is currently estimated at $177,596, approximately $119 per square foot. 6329 Macon Rd is a home located in Shelby County with nearby schools including White Station Elementary School, White Station Middle, and White Station High.
Ownership History
Date
Name
Owned For
Owner Type
Purchase Details
Closed on
Apr 1, 2024
Sold by
Ih Investments
Bought by
Jad Jr Living Trust
Current Estimated Value
Purchase Details
Closed on
Jun 22, 2020
Sold by
Nyseth Gale W and Carroll White S
Bought by
Ih Investments
Purchase Details
Closed on
Oct 13, 2009
Sold by
Wilbanks Darlene and Wilbanks Wayne
Bought by
Wilbanks Darlene and Wilbanks David
Purchase Details
Closed on
Sep 9, 2008
Sold by
White S Carroll
Bought by
Nyseth Gale White and Carroll White S
Purchase Details
Closed on
May 20, 2005
Sold by
White Maryestel F
Bought by
White S Carroll
Purchase Details
Closed on
Dec 1, 2004
Sold by
Clark Gary D
Bought by
White Maryestel F and Carroll White S
Purchase Details
Closed on
Jun 20, 1997
Sold by
Stewart James Elton
Bought by
Clark Gary D
Home Financials for this Owner
Home Financials are based on the most recent Mortgage that was taken out on this home.
Original Mortgage
$60,200
Interest Rate
7.93%
Create a Home Valuation Report for This Property
The Home Valuation Report is an in-depth analysis detailing your home's value as well as a comparison with similar homes in the area
Home Values in the Area
Average Home Value in this Area
Purchase History
| Date | Buyer | Sale Price | Title Company |
|---|---|---|---|
| Jad Jr Living Trust | -- | None Listed On Document | |
| Ih Investments | -- | None Available | |
| Wilbanks Darlene | -- | None Available | |
| Nyseth Gale White | -- | Chicago Title Ins Co | |
| White S Carroll | -- | -- | |
| White Maryestel F | $78,000 | -- | |
| Clark Gary D | $66,900 | -- |
Source: Public Records
Mortgage History
| Date | Status | Borrower | Loan Amount |
|---|---|---|---|
| Previous Owner | Clark Gary D | $60,200 |
Source: Public Records
Tax History Compared to Growth
Tax History
| Year | Tax Paid | Tax Assessment Tax Assessment Total Assessment is a certain percentage of the fair market value that is determined by local assessors to be the total taxable value of land and additions on the property. | Land | Improvement |
|---|---|---|---|---|
| 2025 | $969 | $37,750 | $5,750 | $32,000 |
| 2024 | $969 | $28,575 | $4,250 | $24,325 |
| 2023 | $1,741 | $28,575 | $4,250 | $24,325 |
| 2022 | $1,741 | $28,575 | $4,250 | $24,325 |
| 2021 | $2,069 | $28,575 | $4,250 | $24,325 |
| 2020 | $1,366 | $18,850 | $4,250 | $14,600 |
| 2019 | $602 | $18,850 | $4,250 | $14,600 |
| 2018 | $602 | $18,850 | $4,250 | $14,600 |
| 2017 | $617 | $18,850 | $4,250 | $14,600 |
| 2016 | $782 | $17,900 | $0 | $0 |
| 2014 | $782 | $17,900 | $0 | $0 |
Source: Public Records
Map
Nearby Homes
- 1339 Mullins Station Rd
- 1289 Heathcliff Dr
- 1472 Kinilwood St
- 0 Mullins Station Rd
- 6690 Whitten Pine Dr
- 1461 Phillips Rd
- 6774 Whitten Pine Dr
- 6838 Lagrange Cir N
- 6840 Lagrange Pines Rd
- 6830 Garmin Ln
- 6916 Lagrange Pines Rd
- 6880 Wrigley Dr
- 6925 Raleigh Lagrange Rd
- 7020 Wynne Ridge Rd N
- 0 Summer Ave Unit 10195870
- 0 Summer Ave Unit 10200827
- 0 Summer Ave Unit 10195869
- 7004 Presmond Rd
- 6321 Ashton Rd
- 6990 Parkbrook Ln