633 3rd Ave Columbus, GA 31901
Downtown Columbus NeighborhoodEstimated Value: $269,000 - $330,443
About This Home
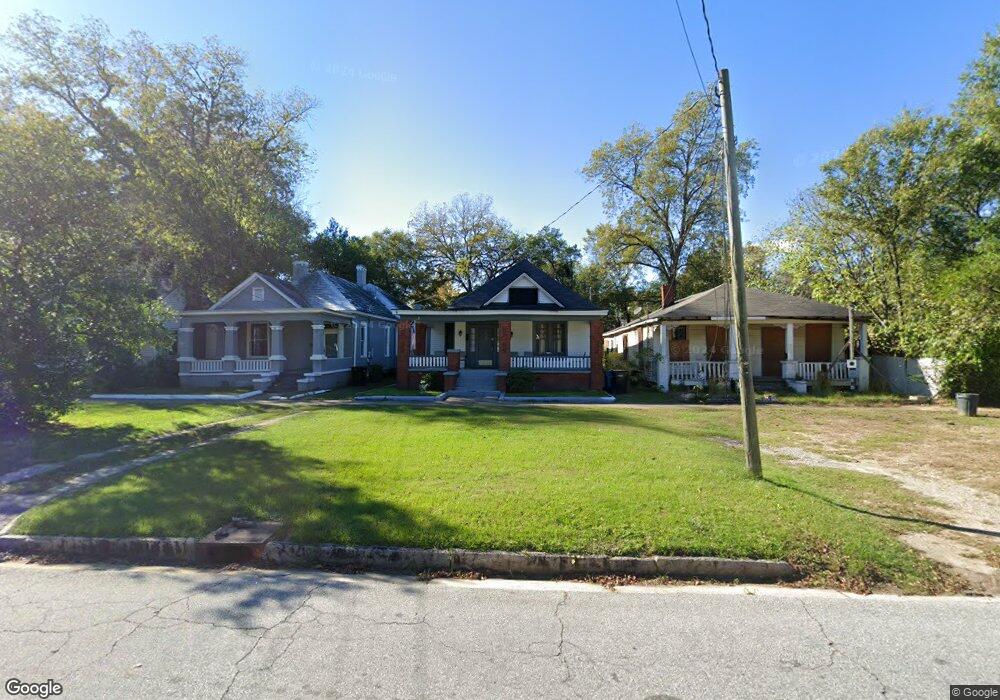
This home is located at 633 3rd Ave, Columbus, GA 31901 and is currently estimated at $311,611, approximately $140 per square foot. 633 3rd Ave is a home located in Muscogee County with nearby schools including Davis Elementary School, Eddy Middle School, and Jordan Vocational High School.
Ownership History
We collect this data history from publicly available records. To have your information removed, we recommend requesting removal directly through your county’s website.
Purchase Details
Purchase Details
Purchase Details
Home Values in the Area
Average Home Value in this Area
Purchase History
We collect this data history from publicly available records. To have your information removed, we recommend requesting removal directly through your county’s website.
| Date | Buyer | Sale Price | Title Company |
|---|---|---|---|
| $157,500 | -- | ||
| $125,682 | -- | ||
| -- | None Available |
Tax History
We collect this data history from publicly available records. To have your information removed, we recommend requesting removal directly through your county’s website.
| Year | Tax Paid | Tax Assessment Tax Assessment Total Assessment is a certain percentage of the fair market value that is determined by local assessors to be the total taxable value of land and additions on the property. | Land | Improvement |
|---|---|---|---|---|
| 2025 | $4,549 | $116,200 | $18,648 | $97,552 |
| 2024 | $3,866 | $116,200 | $18,648 | $97,552 |
| 2023 | $3,975 | $100,920 | $18,648 | $82,272 |
| 2022 | $2,847 | $69,732 | $7,160 | $62,572 |
| 2021 | $1,685 | $60,892 | $7,160 | $53,732 |
| 2020 | $1,685 | $41,264 | $7,160 | $34,104 |
| 2019 | $908 | $40,748 | $7,160 | $33,588 |
| 2018 | $1,940 | $22,164 | $6,649 | $15,515 |
| 2017 | $911 | $22,164 | $6,649 | $15,515 |
| 2016 | $704 | $17,076 | $1,628 | $15,448 |
| 2015 | $705 | $17,076 | $1,628 | $15,448 |
| 2014 | $706 | $17,076 | $1,628 | $15,448 |
| 2013 | -- | $17,076 | $1,628 | $15,448 |
Map
- 633 3rd Ave Unit SI ID1043436P
- 633 3rd Ave Unit ID1043436P
- 629 3rd Ave
- 637 3rd Ave
- 627 3rd Ave
- 216 7th St
- 218 7th St
- 212 7th St
- 222 7th St
- 208 7th St
- 619 3rd Ave
- 619 3rd Ave Unit Furnished Home
- 619 3rd Ave Unit Room C
- 619 3rd Ave Unit Room B
- 619 3rd Ave Unit Room A
- 619 3rd Ave
- 634 2nd Ave
- 632 2nd Ave
- 630 2nd Ave
- 624 2nd Ave
Ask me questions while you tour the home.