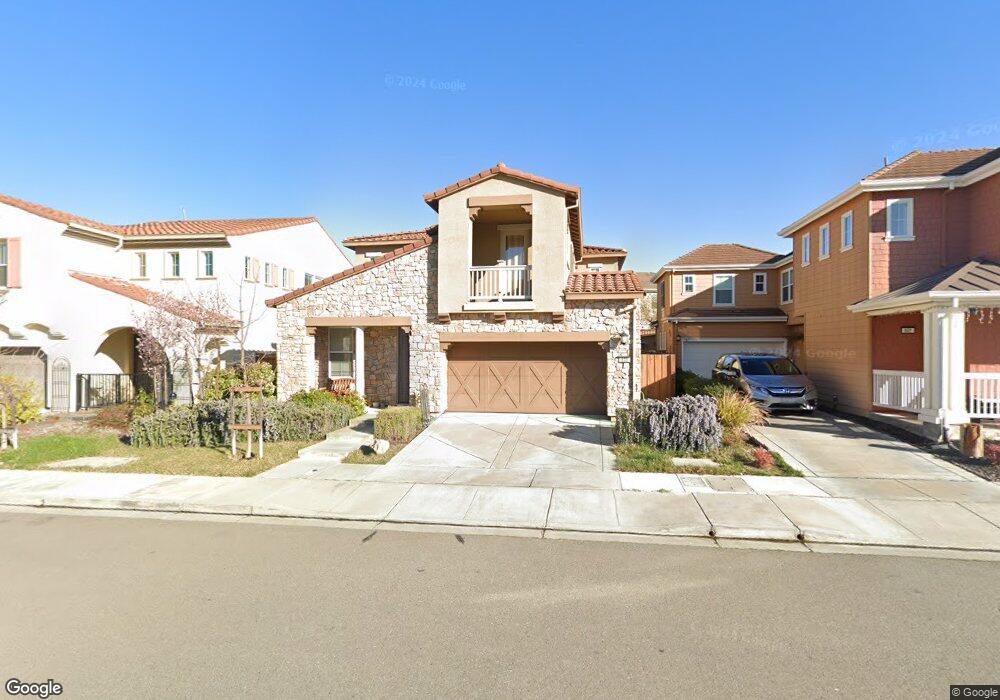
633 Argyle Ct San Ramon, CA 94582
Gale Ranch-Windemere NeighborhoodEstimated Value: $1,824,000 - $1,977,000
4
Beds
3
Baths
2,655
Sq Ft
$718/Sq Ft
Est. Value
About This Home
This home is located at 633 Argyle Ct, San Ramon, CA 94582 and is currently estimated at $1,906,457, approximately $718 per square foot. 633 Argyle Ct is a home located in Contra Costa County with nearby schools including Live Oak Elementary School, Windemere Ranch Middle School, and Dougherty Valley High School.
Ownership History
Date
Name
Owned For
Owner Type
Purchase Details
Closed on
Sep 14, 2020
Sold by
Shi Xiaocen and Ding Li
Bought by
Shi Xiaocen and Ding Li
Current Estimated Value
Home Financials for this Owner
Home Financials are based on the most recent Mortgage that was taken out on this home.
Original Mortgage
$194,000
Outstanding Balance
$138,441
Interest Rate
2.9%
Mortgage Type
New Conventional
Estimated Equity
$1,768,016
Purchase Details
Closed on
Jun 23, 2018
Sold by
Shi Xiaocen and Ding Li
Bought by
Shi Xiaocen and Ding Li
Purchase Details
Closed on
Apr 27, 2007
Sold by
Lennar Homes Of California
Bought by
Shi Xiaocen and Ding Li
Home Financials for this Owner
Home Financials are based on the most recent Mortgage that was taken out on this home.
Original Mortgage
$602,300
Outstanding Balance
$365,760
Interest Rate
6.14%
Mortgage Type
Purchase Money Mortgage
Estimated Equity
$1,540,697
Purchase Details
Closed on
Dec 18, 2006
Sold by
Mw Housing Partners Iii Lp
Bought by
Lennar Homes Of California Inc
Create a Home Valuation Report for This Property
The Home Valuation Report is an in-depth analysis detailing your home's value as well as a comparison with similar homes in the area
Home Values in the Area
Average Home Value in this Area
Purchase History
| Date | Buyer | Sale Price | Title Company |
|---|---|---|---|
| Shi Xiaocen | -- | Accommodation | |
| Shi Xiaocen | -- | Placer Title Company | |
| Shi Xiaocen | -- | None Available | |
| Shi Xiaocen | $866,500 | North American Title Co | |
| Lennar Homes Of California Inc | -- | North American Title Co |
Source: Public Records
Mortgage History
| Date | Status | Borrower | Loan Amount |
|---|---|---|---|
| Open | Shi Xiaocen | $194,000 | |
| Open | Shi Xiaocen | $602,300 |
Source: Public Records
Tax History
| Year | Tax Paid | Tax Assessment Tax Assessment Total Assessment is a certain percentage of the fair market value that is determined by local assessors to be the total taxable value of land and additions on the property. | Land | Improvement |
|---|---|---|---|---|
| 2025 | $18,249 | $1,194,943 | $503,752 | $691,191 |
| 2024 | $18,116 | $1,171,514 | $493,875 | $677,639 |
| 2023 | $18,116 | $1,148,544 | $484,192 | $664,352 |
| 2022 | $17,764 | $1,126,025 | $474,699 | $651,326 |
| 2021 | $17,379 | $1,103,947 | $465,392 | $638,555 |
| 2019 | $17,005 | $1,071,205 | $451,589 | $619,616 |
| 2018 | $16,482 | $1,050,202 | $442,735 | $607,467 |
| 2017 | $16,371 | $1,029,610 | $434,054 | $595,556 |
| 2016 | $16,304 | $1,009,423 | $425,544 | $583,879 |
| 2015 | $15,402 | $930,500 | $392,272 | $538,228 |
| 2014 | $14,983 | $885,000 | $373,091 | $511,909 |
Source: Public Records
Map
Nearby Homes
- 5058 Holborn Way
- 6197 Yardley Ln Unit 93
- 6060 Dalton Way
- 6183 Kearny Way
- 7898 Kennard Ln
- 116 Spalding Ct
- 806 Mornington Ct
- 116 Macedon Ct
- 3132 Ashbrook Ln
- 3138 Ashbrook Ln
- 7240 Carneros Ln
- 7229 Calistoga Ln
- 7228 Carneros Ln
- 2650 Casella Way
- 4067 St Helena Way
- 2464 Millstream Ln Unit 146
- 6132 Alpine Blue Dr
- 205 Zinnia Ct
- 4026 Chalk Hill Way
- 4022 Windsor Way
Your Personal Tour Guide
Ask me questions while you tour the home.