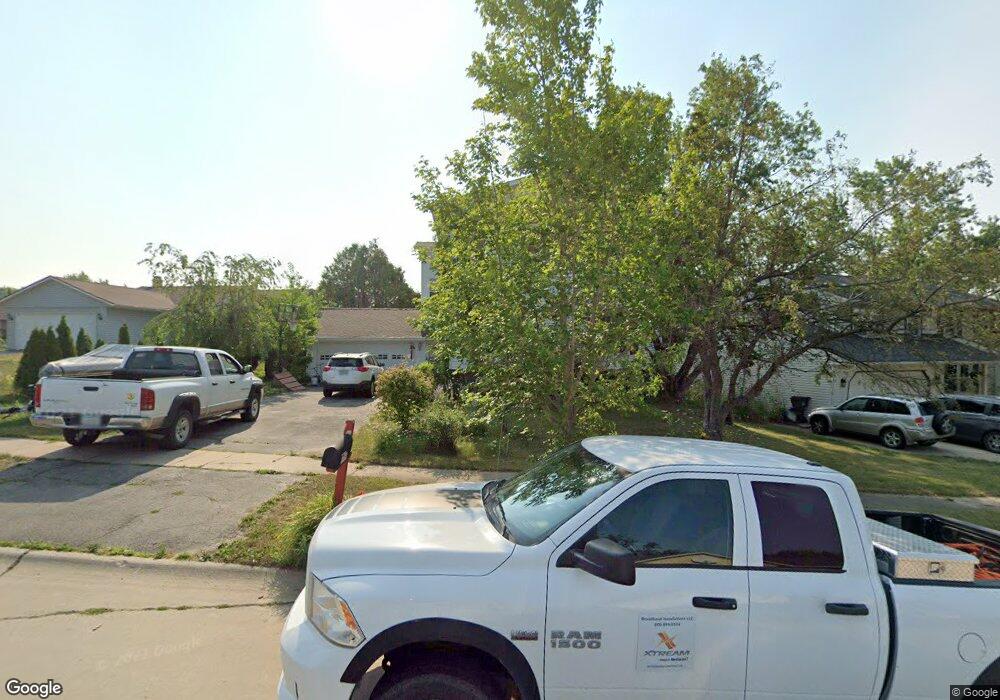
633 Bartlet Ct NW Cedar Rapids, IA 52405
Cherry Hill Park NeighborhoodEstimated Value: $275,000 - $306,000
--
Bed
4
Baths
1,852
Sq Ft
$156/Sq Ft
Est. Value
About This Home
This home is located at 633 Bartlet Ct NW, Cedar Rapids, IA 52405 and is currently estimated at $289,414, approximately $156 per square foot. 633 Bartlet Ct NW is a home located in Linn County with nearby schools including Maple Grove Elementary School, Taft Middle School, and Thomas Jefferson High School.
Ownership History
Date
Name
Owned For
Owner Type
Purchase Details
Closed on
Nov 2, 2016
Sold by
Stealey Douglas A and Stealey Jackie
Bought by
Minor Eric M and Li Wen
Current Estimated Value
Purchase Details
Closed on
Jan 2, 2013
Sold by
Li Wen
Bought by
Li Wen and Stealey Douglas A
Home Financials for this Owner
Home Financials are based on the most recent Mortgage that was taken out on this home.
Original Mortgage
$128,968
Interest Rate
3.28%
Mortgage Type
FHA
Purchase Details
Closed on
Nov 20, 2012
Sold by
El Tawil Taha Atta and Tawill Sara Taha
Bought by
Li Wen
Home Financials for this Owner
Home Financials are based on the most recent Mortgage that was taken out on this home.
Original Mortgage
$128,968
Interest Rate
3.28%
Mortgage Type
FHA
Create a Home Valuation Report for This Property
The Home Valuation Report is an in-depth analysis detailing your home's value as well as a comparison with similar homes in the area
Home Values in the Area
Average Home Value in this Area
Purchase History
| Date | Buyer | Sale Price | Title Company |
|---|---|---|---|
| Minor Eric M | -- | None Available | |
| Li Wen | -- | Dri Title & Escrow | |
| Li Wen | $139,156 | Dri Title & Escrow |
Source: Public Records
Mortgage History
| Date | Status | Borrower | Loan Amount |
|---|---|---|---|
| Previous Owner | Li Wen | $128,968 | |
| Previous Owner | Li Wen | $128,968 |
Source: Public Records
Tax History
| Year | Tax Paid | Tax Assessment Tax Assessment Total Assessment is a certain percentage of the fair market value that is determined by local assessors to be the total taxable value of land and additions on the property. | Land | Improvement |
|---|---|---|---|---|
| 2025 | $4,946 | $304,000 | $44,800 | $259,200 |
| 2024 | $5,062 | $292,300 | $44,800 | $247,500 |
| 2023 | $5,062 | $289,900 | $41,400 | $248,500 |
| 2022 | $4,970 | $248,900 | $37,900 | $211,000 |
| 2021 | $5,378 | $248,900 | $37,900 | $211,000 |
| 2020 | $5,378 | $252,300 | $34,500 | $217,800 |
| 2019 | $5,030 | $241,900 | $31,000 | $210,900 |
Source: Public Records
Map
Nearby Homes
- 650 Olive Dr NW
- 4524 E Ave NW
- 509 Bezdek Dr NW
- 332 Bezdek Dr NW
- 410 Wiley Blvd NW
- 4341 Beecher Ct NW
- 281 Jacolyn Dr NW
- 1211 Wolf Dr NW
- 240 Jacolyn Dr NW
- 236 Jacolyn Dr NW
- 1209 39th Street Rd NW
- 448 Day St NW
- 408 Day St NW
- 3503 East Ave NW
- 3507 E Ave NW Unit F
- 456 Mayberry Dr NW
- 1608 Morris Ave NW
- 5434 Gordon Ave NW
- 3407 H Ave NW
- 138 Autumn Woods Dr NW
- 627 Bartlet Ct NW
- 637 Bartlet Ct NW
- 621 Bartlet Ct NW
- 641 Bartlet Ct NW
- 644 Olive Dr NW
- 632 Olive Dr NW
- 617 Bartlet Ct NW
- 624 Olive Dr NW
- 630 Bartlet Ct NW
- 636 Bartlet Ct NW
- 624 Bartlet Ct NW
- 647 Bartlet Ct NW
- 613 Bartlet Ct NW
- 618 Olive Dr NW
- 618 Bartlet Ct NW
- 648 Bartlet Ct NW
- 642 Bartlet Ct NW
- 720 Olive Dr NW
- 612 Bartlet Ct NW
- 748 Olive Dr NW
Your Personal Tour Guide
Ask me questions while you tour the home.