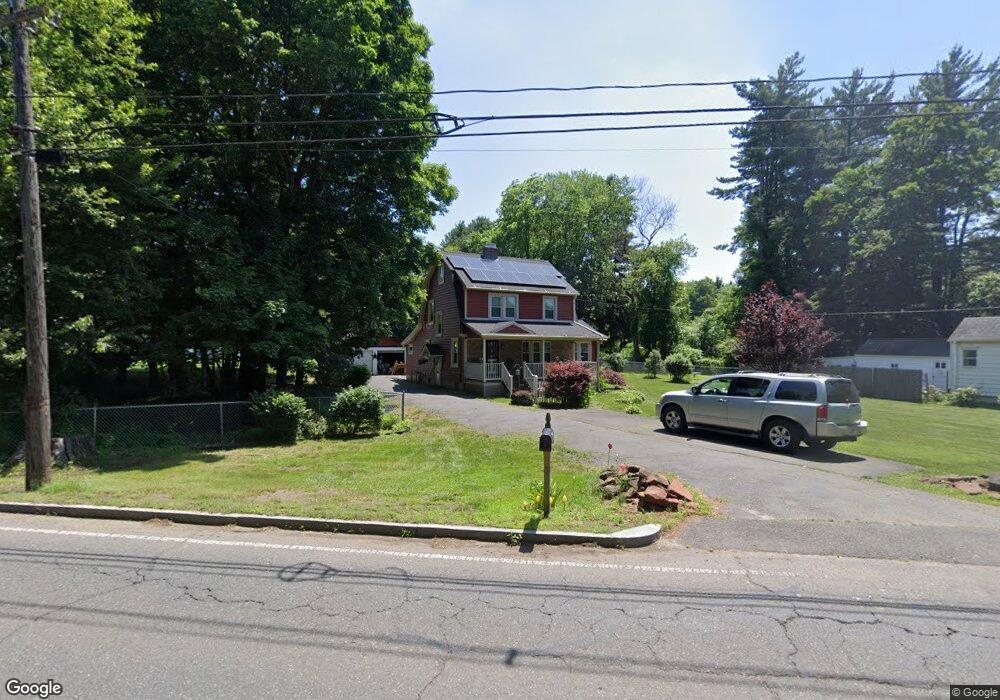
633 Cooley St Springfield, MA 01128
Sixteen Acres NeighborhoodEstimated Value: $356,000 - $367,000
3
Beds
2
Baths
1,590
Sq Ft
$228/Sq Ft
Est. Value
About This Home
This home is located at 633 Cooley St, Springfield, MA 01128 and is currently estimated at $362,814, approximately $228 per square foot. 633 Cooley St is a home located in Hampden County with nearby schools including Daniel B Brunton, M Marcus Kiley Middle, and Springfield High School of Science and Technology.
Ownership History
Date
Name
Owned For
Owner Type
Purchase Details
Closed on
Oct 7, 2015
Sold by
Moses Jacqueline W
Bought by
Cooley Street Nt
Current Estimated Value
Purchase Details
Closed on
Jun 5, 1987
Sold by
Shea John V
Bought by
Moses John H
Home Financials for this Owner
Home Financials are based on the most recent Mortgage that was taken out on this home.
Original Mortgage
$95,000
Interest Rate
10.38%
Mortgage Type
Purchase Money Mortgage
Create a Home Valuation Report for This Property
The Home Valuation Report is an in-depth analysis detailing your home's value as well as a comparison with similar homes in the area
Home Values in the Area
Average Home Value in this Area
Purchase History
| Date | Buyer | Sale Price | Title Company |
|---|---|---|---|
| Cooley Street Nt | -- | -- | |
| Moses John H | $119,000 | -- |
Source: Public Records
Mortgage History
| Date | Status | Borrower | Loan Amount |
|---|---|---|---|
| Previous Owner | Moses John H | $92,500 | |
| Previous Owner | Moses John H | $95,000 |
Source: Public Records
Tax History
| Year | Tax Paid | Tax Assessment Tax Assessment Total Assessment is a certain percentage of the fair market value that is determined by local assessors to be the total taxable value of land and additions on the property. | Land | Improvement |
|---|---|---|---|---|
| 2025 | $5,066 | $323,100 | $83,700 | $239,400 |
| 2024 | $4,828 | $300,600 | $83,700 | $216,900 |
| 2023 | $4,829 | $283,200 | $79,700 | $203,500 |
| 2022 | $4,511 | $239,700 | $79,700 | $160,000 |
| 2021 | $3,771 | $199,500 | $72,500 | $127,000 |
| 2020 | $3,519 | $180,200 | $72,500 | $107,700 |
| 2019 | $3,493 | $177,500 | $72,500 | $105,000 |
| 2018 | $3,414 | $173,500 | $72,500 | $101,000 |
| 2017 | $3,212 | $163,400 | $72,500 | $90,900 |
| 2016 | $3,065 | $155,900 | $72,500 | $83,400 |
| 2015 | $2,947 | $149,800 | $72,500 | $77,300 |
Source: Public Records
Map
Nearby Homes
- 25 Laurelwood Ln
- 1962 Allen St
- 41 Hillside Dr
- 322 Holcomb Rd
- 24 Wands St
- 85 Talmadge Dr
- 0 Apple Blossom Ln
- 86 Talmadge Dr
- 17 Skyridge Ln
- 110 W Crystal Brook Dr
- 17 Pebble Mill Rd
- 86 Wildwood Ave
- 81 W Crystal Brook Dr
- 68 Tallyho Dr
- 137 Mapleshade Ave
- 49 Corcoran Blvd
- 206 Treetop Ave
- 136 Thompkins Ave
- 65 Helen Cir
- 153 Elm St
Your Personal Tour Guide
Ask me questions while you tour the home.