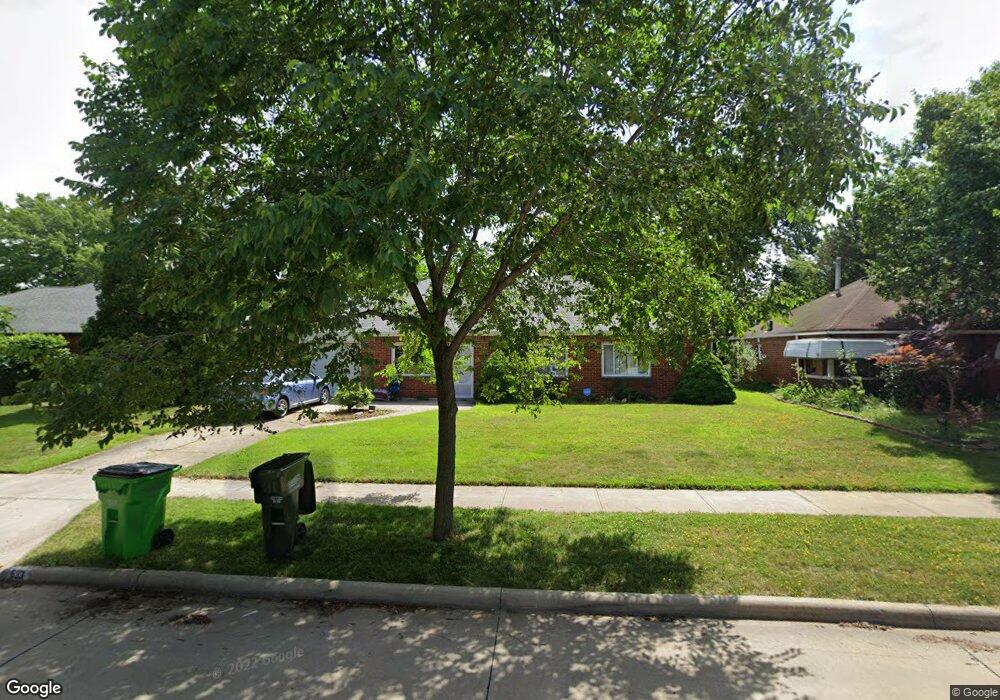
633 Hemlock Dr Euclid, OH 44132
Estimated Value: $160,292 - $198,000
3
Beds
2
Baths
1,423
Sq Ft
$122/Sq Ft
Est. Value
About This Home
This home is located at 633 Hemlock Dr, Euclid, OH 44132 and is currently estimated at $173,573, approximately $121 per square foot. 633 Hemlock Dr is a home located in Cuyahoga County with nearby schools including Shoreview Elementary School, Euclid High School, and Ss. Robert & William Catholic School.
Ownership History
Date
Name
Owned For
Owner Type
Purchase Details
Closed on
May 14, 2003
Sold by
Styles Kimberly A and Parker Kimberly A
Bought by
Styles Ronald D and Styles Kimberly A
Current Estimated Value
Purchase Details
Closed on
Nov 22, 1991
Sold by
Parker David A
Bought by
Parker Kimberly
Purchase Details
Closed on
Jan 30, 1990
Sold by
Will Kris A
Bought by
Parker David A
Purchase Details
Closed on
Oct 20, 1976
Sold by
Wills Helen
Bought by
Will Kris A
Purchase Details
Closed on
Jun 10, 1976
Sold by
Will Karl W
Bought by
Wills Helen
Purchase Details
Closed on
Jun 9, 1976
Sold by
Wills Gustave
Bought by
Will Karl W
Purchase Details
Closed on
Jan 1, 1975
Bought by
Wills Gustave
Create a Home Valuation Report for This Property
The Home Valuation Report is an in-depth analysis detailing your home's value as well as a comparison with similar homes in the area
Home Values in the Area
Average Home Value in this Area
Purchase History
| Date | Buyer | Sale Price | Title Company |
|---|---|---|---|
| Styles Ronald D | -- | -- | |
| Parker Kimberly | -- | -- | |
| Parker David A | $55,000 | -- | |
| Will Kris A | -- | -- | |
| Wills Helen | -- | -- | |
| Will Karl W | -- | -- | |
| Wills Gustave | -- | -- |
Source: Public Records
Tax History Compared to Growth
Tax History
| Year | Tax Paid | Tax Assessment Tax Assessment Total Assessment is a certain percentage of the fair market value that is determined by local assessors to be the total taxable value of land and additions on the property. | Land | Improvement |
|---|---|---|---|---|
| 2024 | $3,489 | $50,785 | $9,660 | $41,125 |
| 2023 | $3,365 | $39,170 | $8,540 | $30,630 |
| 2022 | $3,288 | $39,165 | $8,540 | $30,625 |
| 2021 | $3,660 | $39,170 | $8,540 | $30,630 |
| 2020 | $3,071 | $29,680 | $6,480 | $23,210 |
| 2019 | $2,762 | $84,800 | $18,500 | $66,300 |
| 2018 | $1,496 | $29,680 | $6,480 | $23,210 |
| 2017 | $2,992 | $26,010 | $5,180 | $20,830 |
| 2016 | $2,999 | $26,010 | $5,180 | $20,830 |
| 2015 | $2,952 | $26,010 | $5,180 | $20,830 |
| 2014 | $2,952 | $26,010 | $5,180 | $20,830 |
Source: Public Records
Map
Nearby Homes
- 27190 Shoreview Ave
- 577 Sycamore Dr
- 559 Sycamore Dr
- 27101 Zeman Ave
- 26951 Shirley Ave
- 546 Walnut Dr
- 29038 Fuller Ave
- 461 E 271st St
- 712 E 266th St
- 440 E 271st St
- 26471 Farringdon Ave
- 26471 Shoreview Ave
- 780 E 266th St
- 445 E 275th St
- 26351 Farringdon Ave
- 26430 Drakefield Ave
- 415 E 266th St
- 970 Bryn Mawr Ave
- 635 E 261st St
- 26171 Shoreview Ave
- 623 Hemlock Dr
- 643 Hemlock Dr
- 630 Sycamore Dr
- 619 Hemlock Dr
- 620 Sycamore Dr
- 651 Hemlock Dr
- 640 Sycamore Dr
- 630 Hemlock Dr
- 650 Sycamore Dr
- 610 Sycamore Dr
- 640 Hemlock Dr
- 620 Hemlock Dr
- 609 Hemlock Dr
- 610 Hemlock Dr
- 650 Hemlock Dr
- 600 Sycamore Dr
- 661 Hemlock Dr
- 600 Hemlock Dr
- 597 Hemlock Dr
- 660 Sycamore Dr