633 Martin St Longmont, CO 80501
Kensington NeighborhoodEstimated Value: $338,019 - $433,000
2
Beds
1
Bath
792
Sq Ft
$476/Sq Ft
Est. Value
About This Home
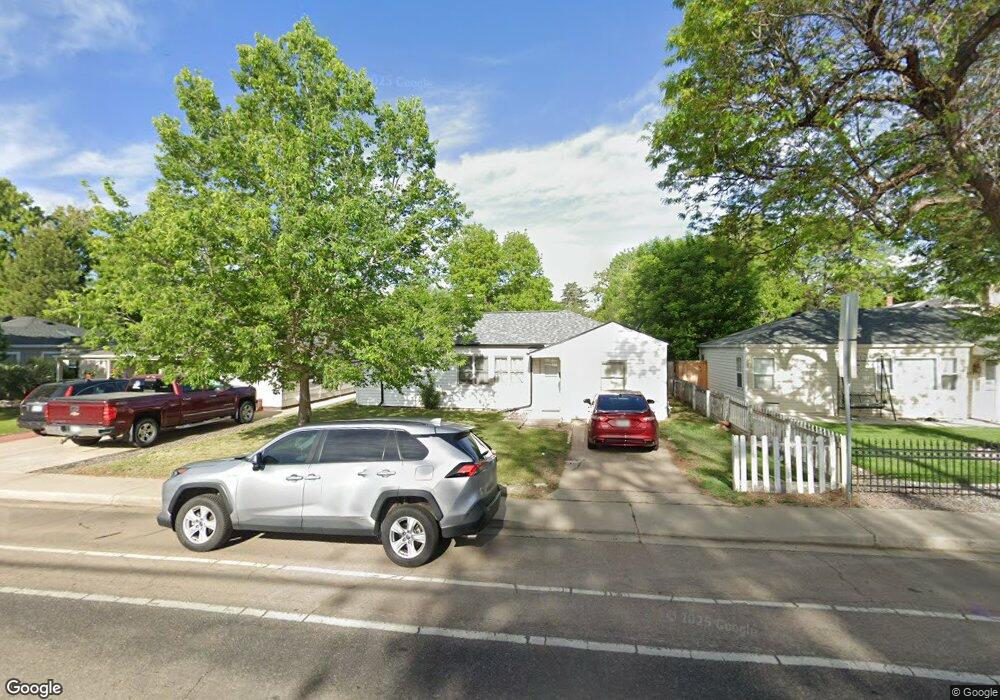
This home is located at 633 Martin St, Longmont, CO 80501 and is currently estimated at $377,005, approximately $476 per square foot. 633 Martin St is a home located in Boulder County with nearby schools including Columbine Elementary School, Trail Ridge Middle School, and Skyline High School.
Ownership History
Date
Name
Owned For
Owner Type
Purchase Details
Closed on
May 14, 2015
Sold by
Versch Francis E
Bought by
Doty Season Lee
Current Estimated Value
Home Financials for this Owner
Home Financials are based on the most recent Mortgage that was taken out on this home.
Original Mortgage
$150,000
Interest Rate
4%
Mortgage Type
Seller Take Back
Purchase Details
Closed on
May 10, 2011
Sold by
Parson Leithe
Bought by
Versch Francis E
Purchase Details
Closed on
Sep 16, 2002
Sold by
Versch Francis E and Versch Georgia F
Bought by
Parsons Leithe
Home Financials for this Owner
Home Financials are based on the most recent Mortgage that was taken out on this home.
Original Mortgage
$120,000
Interest Rate
8%
Mortgage Type
Seller Take Back
Purchase Details
Closed on
Oct 14, 1993
Sold by
Versch Francis E and Versch Georgia F
Bought by
Versch Francis E
Purchase Details
Closed on
Aug 10, 1982
Bought by
Doty Season Lee
Purchase Details
Closed on
Dec 24, 1952
Bought by
Doty Season Lee
Create a Home Valuation Report for This Property
The Home Valuation Report is an in-depth analysis detailing your home's value as well as a comparison with similar homes in the area
Home Values in the Area
Average Home Value in this Area
Purchase History
| Date | Buyer | Sale Price | Title Company |
|---|---|---|---|
| Doty Season Lee | $150,000 | Land Title Guarantee Company | |
| Versch Francis E | -- | None Available | |
| Parsons Leithe | $125,000 | -- | |
| Versch Francis E | -- | -- | |
| Doty Season Lee | $45,000 | -- | |
| Doty Season Lee | -- | -- |
Source: Public Records
Mortgage History
| Date | Status | Borrower | Loan Amount |
|---|---|---|---|
| Closed | Doty Season Lee | $150,000 | |
| Previous Owner | Parsons Leithe | $120,000 |
Source: Public Records
Tax History Compared to Growth
Tax History
| Year | Tax Paid | Tax Assessment Tax Assessment Total Assessment is a certain percentage of the fair market value that is determined by local assessors to be the total taxable value of land and additions on the property. | Land | Improvement |
|---|---|---|---|---|
| 2025 | $1,855 | $21,275 | $8,244 | $13,031 |
| 2024 | $1,855 | $21,275 | $8,244 | $13,031 |
| 2023 | $1,830 | $19,397 | $9,099 | $13,983 |
| 2022 | $1,725 | $17,430 | $6,616 | $10,814 |
| 2021 | $1,747 | $17,932 | $6,807 | $11,125 |
| 2020 | $1,752 | $18,039 | $7,865 | $10,174 |
| 2019 | $1,725 | $18,039 | $7,865 | $10,174 |
| 2018 | $1,457 | $15,336 | $7,920 | $7,416 |
| 2017 | $1,437 | $16,955 | $8,756 | $8,199 |
| 2016 | $1,214 | $12,696 | $7,403 | $5,293 |
| 2015 | $1,156 | $10,324 | $4,139 | $6,185 |
| 2014 | $1,123 | $10,324 | $4,139 | $6,185 |
Source: Public Records
Map
Nearby Homes
- 641 Martin St
- 727 Baker St
- 29 Marshall Place
- 531 Atwood St
- 428 Baker St
- 845 Martin St
- 643 Collyer St
- 146 E Saint Clair Ave Unit 148
- 149 E 6th Ave
- 225 E 8th Ave Unit E20
- 225 E 8th Ave Unit A2
- 225 E 8th Ave Unit E10
- 36 Reed Place
- 823 Collyer St
- 348 Collyer St Unit 105
- 400 Emery St Unit 302
- 400 Emery St Unit 208
- 830 Emery St
- 342 9th Ave
- 736 Kimbark St