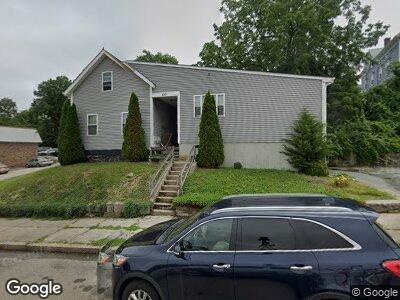
633 N Main St Fall River, MA 02720
Lower Highlands NeighborhoodEstimated Value: $423,000 - $528,000
6
Beds
3
Baths
2,349
Sq Ft
$211/Sq Ft
Est. Value
About This Home
This home is located at 633 N Main St, Fall River, MA 02720 and is currently estimated at $494,497, approximately $210 per square foot. 633 N Main St is a home located in Bristol County with nearby schools including Mary Fonseca Elementary School, Morton Middle School, and B M C Durfee High School.
Ownership History
Date
Name
Owned For
Owner Type
Purchase Details
Closed on
Apr 20, 2004
Sold by
Correia John and Correia Keith J
Bought by
Grady Kimberly A and Grady Sean D
Current Estimated Value
Home Financials for this Owner
Home Financials are based on the most recent Mortgage that was taken out on this home.
Original Mortgage
$220,539
Outstanding Balance
$107,066
Interest Rate
5.58%
Mortgage Type
Purchase Money Mortgage
Estimated Equity
$401,068
Purchase Details
Closed on
Oct 1, 1991
Sold by
Jordan Rt
Bought by
Correia John
Home Financials for this Owner
Home Financials are based on the most recent Mortgage that was taken out on this home.
Original Mortgage
$50,000
Interest Rate
9.1%
Mortgage Type
Purchase Money Mortgage
Create a Home Valuation Report for This Property
The Home Valuation Report is an in-depth analysis detailing your home's value as well as a comparison with similar homes in the area
Home Values in the Area
Average Home Value in this Area
Purchase History
| Date | Buyer | Sale Price | Title Company |
|---|---|---|---|
| Grady Kimberly A | $224,000 | -- | |
| Correia John | $60,000 | -- |
Source: Public Records
Mortgage History
| Date | Status | Borrower | Loan Amount |
|---|---|---|---|
| Open | Grady Kimberly A | $220,539 | |
| Previous Owner | Farrington Carleen E | $196,500 | |
| Previous Owner | Correia John | $135,000 | |
| Previous Owner | Correia John | $50,000 |
Source: Public Records
Tax History Compared to Growth
Tax History
| Year | Tax Paid | Tax Assessment Tax Assessment Total Assessment is a certain percentage of the fair market value that is determined by local assessors to be the total taxable value of land and additions on the property. | Land | Improvement |
|---|---|---|---|---|
| 2025 | $5,212 | $455,200 | $114,300 | $340,900 |
| 2024 | $4,759 | $414,200 | $110,100 | $304,100 |
| 2023 | $4,317 | $351,800 | $91,000 | $260,800 |
| 2022 | $3,666 | $316,000 | $86,700 | $229,300 |
| 2021 | $3,666 | $265,100 | $82,400 | $182,700 |
| 2020 | $3,279 | $226,900 | $81,200 | $145,700 |
| 2019 | $3,106 | $213,000 | $78,200 | $134,800 |
| 2018 | $2,727 | $186,500 | $84,700 | $101,800 |
| 2017 | $2,475 | $176,800 | $80,800 | $96,000 |
| 2016 | $2,445 | $179,400 | $85,900 | $93,500 |
| 2015 | $2,347 | $179,400 | $85,900 | $93,500 |
| 2014 | $2,334 | $185,500 | $83,400 | $102,100 |
Source: Public Records
Map
Nearby Homes
- 56 Gatehouse Dr
- 351 Danforth St Unit 8
- 349 Danforth St Unit 7
- 750 Davol St Unit 813
- 72 Belmont St
- 787 High St
- 257 French St
- 909 High St
- 107 Danforth St
- 52 Underwood St
- 262 Cherry St
- 264 Cherry St
- 206 Durfee St Unit 1A
- 206 Durfee St Unit 3A
- 206 Durfee St Unit 3B
- 206 Durfee St Unit 4A
- 341 Belmont St
- 1116 N Main St Unit 1124
- 327 Brownell St
- 381 Pine St
- 633 N Main St
- 16 Barnaby St
- 28 Barnaby St
- 22 Prospect St
- 34 Barnaby St
- 591 N Main St
- 570 N Main St Unit 2
- 36 Prospect St
- 574 N Main St
- 52 Barnaby St
- 650 N Main St
- 655 N Main St Unit 4
- 655 N Main St Unit 10
- 675 N Main St Unit 19
- 675 N Main St Unit 20
- 655 N Main St Unit 7
- 655 N Main St Unit 5
- 675 N Main St Unit 11
- 675 N Main St Unit 18
- 640 N Main St