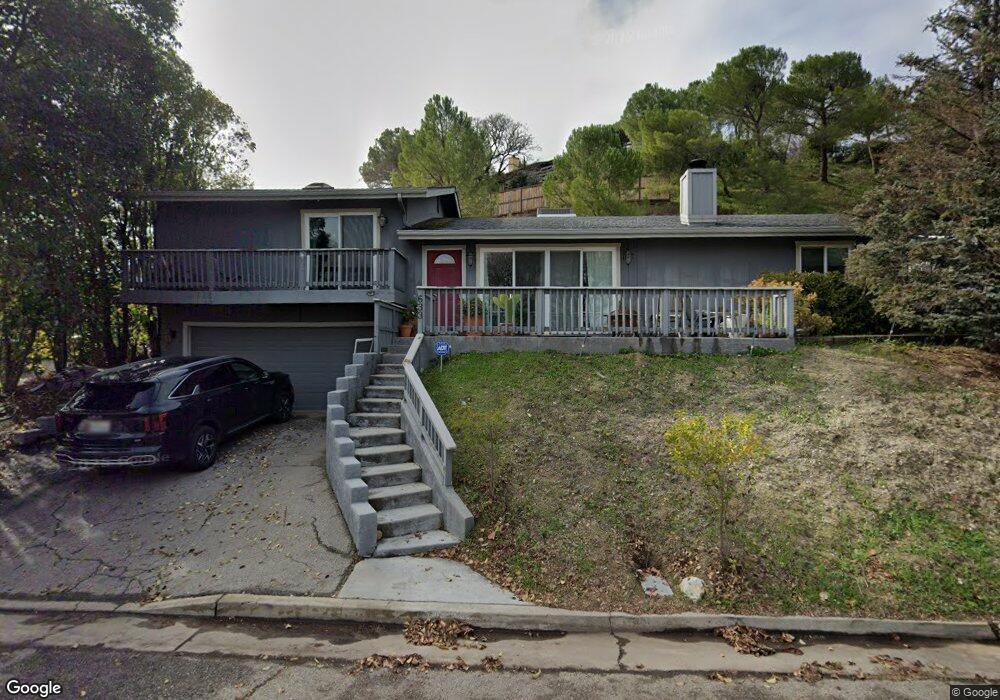
633 Olive St Paso Robles, CA 93446
Estimated Value: $605,000 - $784,000
3
Beds
3
Baths
1,500
Sq Ft
$475/Sq Ft
Est. Value
About This Home
This home is located at 633 Olive St, Paso Robles, CA 93446 and is currently estimated at $712,247, approximately $474 per square foot. 633 Olive St is a home located in San Luis Obispo County with nearby schools including Glen Speck Elementary School, George H. Flamson Middle School, and Paso Robles High School.
Ownership History
Date
Name
Owned For
Owner Type
Purchase Details
Closed on
Aug 25, 2010
Sold by
Bates Enterprises Llc
Bought by
Norton James J
Current Estimated Value
Home Financials for this Owner
Home Financials are based on the most recent Mortgage that was taken out on this home.
Original Mortgage
$185,000
Outstanding Balance
$114,870
Interest Rate
3.37%
Mortgage Type
New Conventional
Estimated Equity
$597,377
Purchase Details
Closed on
Jul 7, 2006
Sold by
Welfringer Lynn M
Bought by
Bates Welfringer Judy L
Purchase Details
Closed on
Aug 7, 2000
Sold by
Milligan Mike W and Milligan Heidi C
Bought by
Bates Enterprises
Purchase Details
Closed on
Jul 5, 1995
Sold by
Coolidge Elma V and Elma V Coolidge Living Revocab
Bought by
Milligan Mike W and Milligan Heidi C
Home Financials for this Owner
Home Financials are based on the most recent Mortgage that was taken out on this home.
Original Mortgage
$113,088
Interest Rate
7.62%
Mortgage Type
FHA
Create a Home Valuation Report for This Property
The Home Valuation Report is an in-depth analysis detailing your home's value as well as a comparison with similar homes in the area
Purchase History
| Date | Buyer | Sale Price | Title Company |
|---|---|---|---|
| Norton James J | $275,000 | Fidelity National Title Co | |
| Bates Enterprises Llc | -- | Fidelity National Title Co | |
| Bates Welfringer Judy L | -- | Fidelity National Title Co | |
| Bates Larry M | -- | Fidelity National Title Co | |
| Bates Welfringer Judy L | -- | Fidelity National Title Co | |
| Bates Enterprises | $183,000 | Fidelity National Title Co | |
| Milligan Mike W | $114,000 | Chicago Title Co |
Source: Public Records
Mortgage History
| Date | Status | Borrower | Loan Amount |
|---|---|---|---|
| Open | Norton James J | $185,000 | |
| Previous Owner | Milligan Mike W | $113,088 |
Source: Public Records
Tax History
| Year | Tax Paid | Tax Assessment Tax Assessment Total Assessment is a certain percentage of the fair market value that is determined by local assessors to be the total taxable value of land and additions on the property. | Land | Improvement |
|---|---|---|---|---|
| 2025 | $3,762 | $352,308 | $128,110 | $224,198 |
| 2024 | $3,699 | $345,401 | $125,599 | $219,802 |
| 2023 | $3,699 | $338,630 | $123,137 | $215,493 |
| 2022 | $3,643 | $331,991 | $120,723 | $211,268 |
| 2021 | $3,579 | $325,482 | $118,356 | $207,126 |
| 2020 | $3,530 | $322,146 | $117,143 | $205,003 |
| 2019 | $3,478 | $315,831 | $114,847 | $200,984 |
| 2018 | $3,429 | $309,640 | $112,596 | $197,044 |
| 2017 | $3,223 | $303,570 | $110,389 | $193,181 |
| 2016 | $3,158 | $297,619 | $108,225 | $189,394 |
| 2015 | $3,145 | $293,150 | $106,600 | $186,550 |
| 2014 | $3,035 | $287,408 | $104,512 | $182,896 |
Source: Public Records
Map
Nearby Homes
Your Personal Tour Guide
Ask me questions while you tour the home.