633 Shoshone St South Lake Tahoe, CA 96150
Estimated payment $3,427/month
Highlights
- Built-In Refrigerator
- Deck
- Vaulted Ceiling
- Mountain View
- Property is near a forest
- 1 Car Attached Garage
About This Home
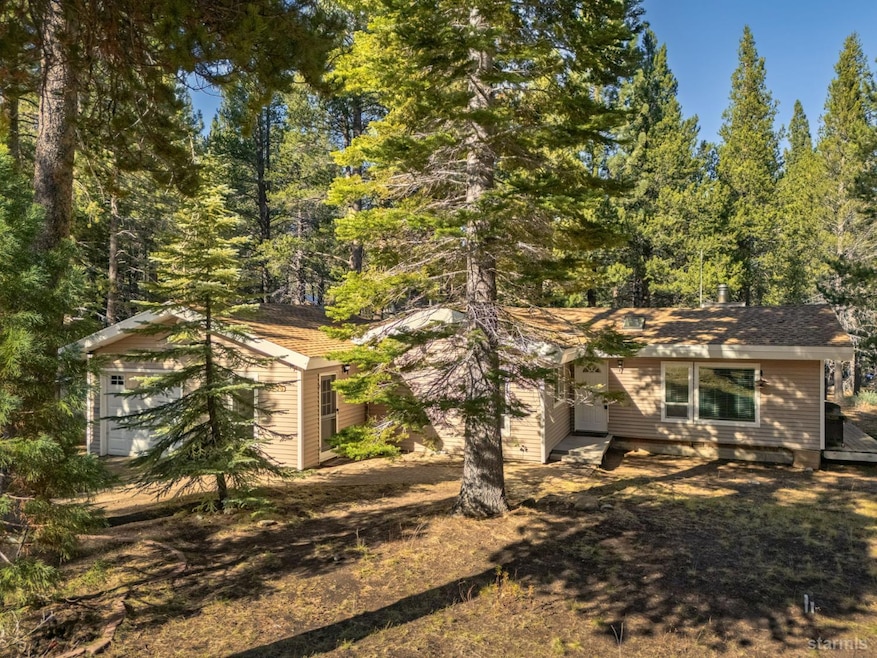
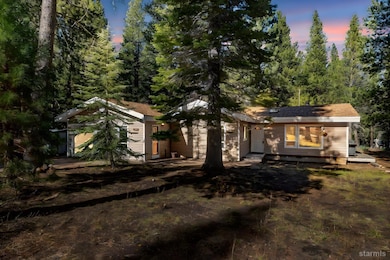
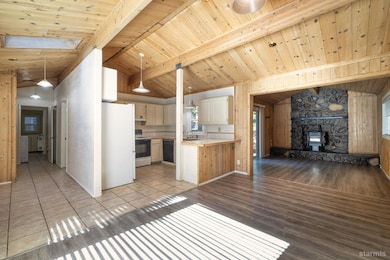
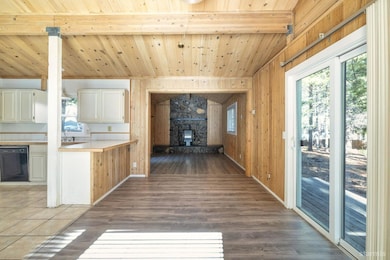
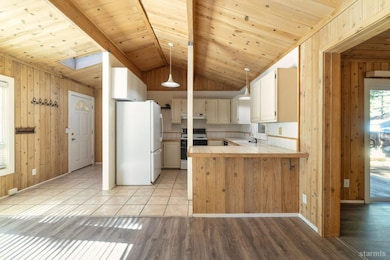
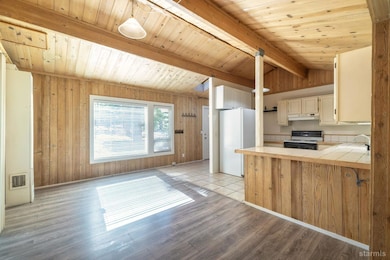
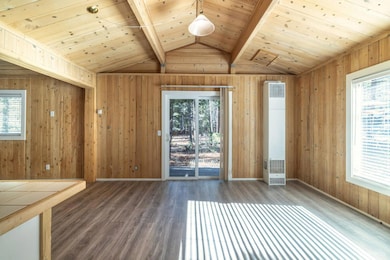
Welcome to 633 Shoshone Street a charming single-level ranch style home that offers both comfort and convenience. Whether you are searching for a relaxing weekend retreat, purchasing your first home, or seeking an appealing investment property, this residence is thoughtfully designed to meet a variety of needs.Interior Features:This inviting home features three bedrooms and two full bathrooms, providing ample space for family or guests. The kitchen is both accommodating and functional, seamlessly connecting to a charming living room. The open beam vaulted ceilings, complemented by a natural wood interior, create a warm and welcoming atmosphere throughout the living spaces.Outdoor Living:Step outside to a fully fenced, large backyard an ideal setting for relaxation or entertaining friends and family. The generous outdoor area allows for privacy and versatility, making it perfect for gatherings or quiet moments alike.Location and Recreation:Located in a great county setting and surrounded by conservacny land for added privacy, this home offers easy access to nearby hiking and biking trails, allowing you to enjoy the beauty of the outdoors right outside your door. Experience the best of both tranquility and adventure in this desirable location.
Home Details
Home Type
- Single Family
Est. Annual Taxes
- $4,429
Year Built
- Built in 1976
Lot Details
- 10,019 Sq Ft Lot
- Natural State Vegetation
- Landscaped with Trees
Parking
- 1 Car Attached Garage
Property Views
- Mountain
- Forest
Home Design
- Pitched Roof
- Composition Roof
- Vinyl Siding
Interior Spaces
- 1,192 Sq Ft Home
- 1-Story Property
- Vaulted Ceiling
- Double Pane Windows
- Vinyl Clad Windows
- Combination Dining and Living Room
- Crawl Space
- Laundry in Hall
Kitchen
- Oven
- Electric Range
- Built-In Refrigerator
- Dishwasher
- Tile Countertops
- Disposal
Flooring
- Laminate
- Tile
Bedrooms and Bathrooms
- 3 Bedrooms
- 2 Full Bathrooms
- Tile Bathroom Countertop
- Bathtub and Shower Combination in Primary Bathroom
Outdoor Features
- Deck
- Patio
Location
- Property is near a forest
Utilities
- Forced Air Heating System
- Heating System Uses Natural Gas
- Heating System Mounted To A Wall or Window
- Natural Gas Water Heater
- Phone Available
- Cable TV Available
Community Details
- Tahoe Paradise 19 Subdivision
- The community has rules related to covenants, conditions, and restrictions
Listing and Financial Details
- Assessor Parcel Number 033343018000
Map
Home Values in the Area
Average Home Value in this Area
Tax History
| Year | Tax Paid | Tax Assessment Tax Assessment Total Assessment is a certain percentage of the fair market value that is determined by local assessors to be the total taxable value of land and additions on the property. | Land | Improvement |
|---|---|---|---|---|
| 2025 | $4,429 | $415,148 | $166,533 | $248,615 |
| 2024 | $4,429 | $407,009 | $163,268 | $243,741 |
| 2023 | $4,353 | $399,029 | $160,067 | $238,962 |
| 2022 | $4,310 | $391,206 | $156,929 | $234,277 |
| 2021 | $7,026 | $383,536 | $153,852 | $229,684 |
| 2020 | $4,183 | $379,604 | $152,275 | $227,329 |
| 2019 | $4,163 | $372,162 | $149,290 | $222,872 |
| 2018 | $4,071 | $364,865 | $146,363 | $218,502 |
| 2017 | $4,007 | $357,712 | $143,494 | $214,218 |
| 2016 | $3,669 | $334,000 | $140,000 | $194,000 |
| 2015 | $3,076 | $284,500 | $114,000 | $170,500 |
| 2014 | $3,076 | $284,500 | $114,000 | $170,500 |
Property History
| Date | Event | Price | List to Sale | Price per Sq Ft |
|---|---|---|---|---|
| 11/21/2025 11/21/25 | Pending | -- | -- | -- |
| 11/01/2025 11/01/25 | For Sale | $579,000 | -- | $486 / Sq Ft |
Purchase History
| Date | Type | Sale Price | Title Company |
|---|---|---|---|
| Grant Deed | -- | None Available | |
| Grant Deed | -- | Old Republic Title Company | |
| Grant Deed | $138,000 | Placer Title Company | |
| Grant Deed | $85,000 | Placer Title Company |
Mortgage History
| Date | Status | Loan Amount | Loan Type |
|---|---|---|---|
| Previous Owner | $124,200 | No Value Available | |
| Previous Owner | $6,000 | Seller Take Back |
Source: South Tahoe Association of REALTORS®
MLS Number: 142311
APN: 033-343-018-000
Disclaimer: Certain information contained herein is derived from information provided by parties other than Homes.com. All information provided is deemed reliable, but is not guaranteed to be accurate and should be independently verified.
![]() Information being provided is for consumers' personal, non-commercial use and may not be used for any purpose other than to identify prospective properties consumers may be interested in purchasing. Information deemed reliable but not guaranteed.
Information being provided is for consumers' personal, non-commercial use and may not be used for any purpose other than to identify prospective properties consumers may be interested in purchasing. Information deemed reliable but not guaranteed.
© Copyright South Tahoe Association of Realtors.
Based on information from the South Tahoe Association of REALTORS® MLS. All data, including all measurements and calculations of area, is obtained from various sources and has not been, and will not be, verified by broker or MLS. All information should be independently reviewed and verified for accuracy. Properties may or may not be listed by the office/agent presenting the information.
- 715 Shoshone St
- 1581 Estate Ct
- 654 Tehama Dr
- 511 Little Mountain Ln
- 1741 Delaware St
- 539 Wintoon Dr
- 1879 Pima St
- 1885 Mewuk Dr
- 1871 Normuk St
- 1966 Nez Perce Dr
- 2051 Nez Perce Dr
- 1082 Mountain Canary Dr
- 2113 Oaxaco St
- 1140 Sioux St
- 1666 Arapahoe St
- 1982 Cherokee St
- 1675 Arapahoe St
- 2001 Washoe St
- 1607 Southern Pines Dr
- 350 Glenmore Way
