Estimated Value: $261,406 - $322,000
3
Beds
2
Baths
1,086
Sq Ft
$263/Sq Ft
Est. Value
About This Home
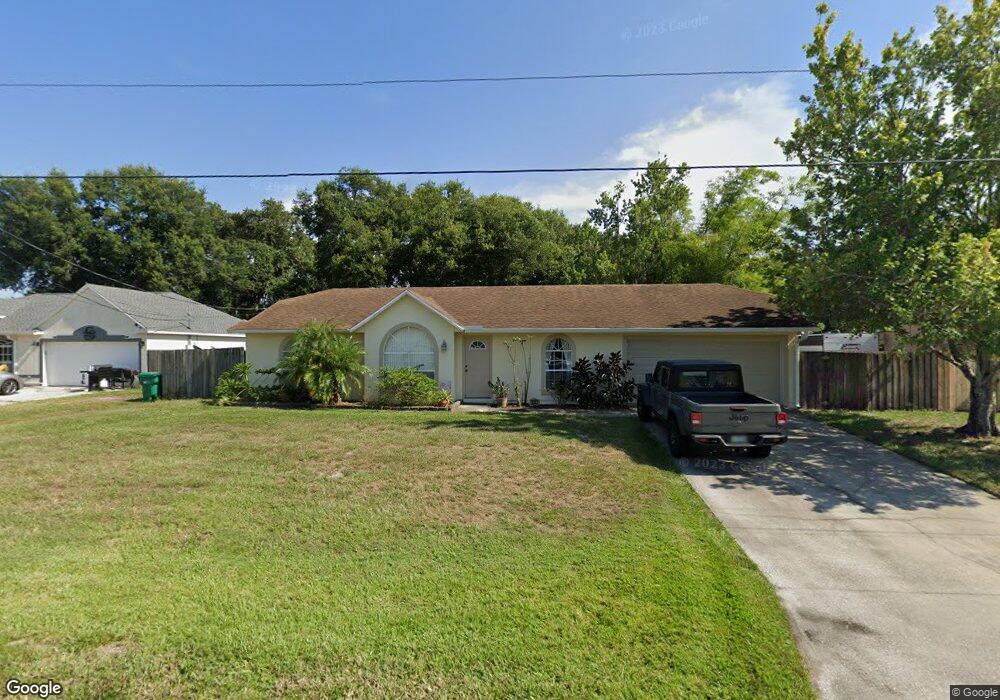
This home is located at 6331 Brack St, Cocoa, FL 32927 and is currently estimated at $285,602, approximately $262 per square foot. 6331 Brack St is a home located in Brevard County with nearby schools including Enterprise Elementary School and Space Coast Junior/Senior High School.
Ownership History
Date
Name
Owned For
Owner Type
Purchase Details
Closed on
Nov 5, 2012
Sold by
Jones Peter G and Golden Jennifer L
Bought by
Jones Peter G and Jones Jennifer L
Current Estimated Value
Purchase Details
Closed on
Aug 29, 2000
Sold by
Sanders Lucinda
Bought by
Jones Peter G and Golden Jennifer L
Home Financials for this Owner
Home Financials are based on the most recent Mortgage that was taken out on this home.
Original Mortgage
$73,600
Interest Rate
8.11%
Mortgage Type
Purchase Money Mortgage
Purchase Details
Closed on
May 7, 1998
Sold by
Dept Housing & Urban Dev
Bought by
Sanders Lucinda J
Home Financials for this Owner
Home Financials are based on the most recent Mortgage that was taken out on this home.
Original Mortgage
$66,250
Interest Rate
7.1%
Purchase Details
Closed on
Jan 12, 1998
Sold by
F T Mtg Co
Bought by
Housing & Urban Dev
Purchase Details
Closed on
Dec 16, 1997
Sold by
Clerk Circuit Court
Bought by
Ft Mtg Co and 1St Tenn Mtg Co Inc
Create a Home Valuation Report for This Property
The Home Valuation Report is an in-depth analysis detailing your home's value as well as a comparison with similar homes in the area
Home Values in the Area
Average Home Value in this Area
Purchase History
| Date | Buyer | Sale Price | Title Company |
|---|---|---|---|
| Jones Peter G | -- | None Available | |
| Jones Peter G | $74,000 | -- | |
| Sanders Lucinda J | $57,600 | -- | |
| Housing & Urban Dev | -- | -- | |
| Ft Mtg Co | -- | -- |
Source: Public Records
Mortgage History
| Date | Status | Borrower | Loan Amount |
|---|---|---|---|
| Previous Owner | Jones Peter G | $73,600 | |
| Previous Owner | Sanders Lucinda J | $66,250 |
Source: Public Records
Tax History
| Year | Tax Paid | Tax Assessment Tax Assessment Total Assessment is a certain percentage of the fair market value that is determined by local assessors to be the total taxable value of land and additions on the property. | Land | Improvement |
|---|---|---|---|---|
| 2025 | $964 | $74,740 | -- | -- |
| 2024 | $946 | $72,640 | -- | -- |
| 2023 | $946 | $70,530 | $0 | $0 |
| 2022 | $892 | $68,480 | $0 | $0 |
| 2021 | $895 | $66,490 | $0 | $0 |
| 2020 | $862 | $65,580 | $0 | $0 |
| 2019 | $810 | $64,110 | $0 | $0 |
| 2018 | $812 | $62,920 | $0 | $0 |
| 2017 | $816 | $61,630 | $0 | $0 |
| 2016 | $822 | $60,370 | $18,000 | $42,370 |
| 2015 | $829 | $59,960 | $15,000 | $44,960 |
| 2014 | $834 | $59,490 | $11,000 | $48,490 |
Source: Public Records
Map
Nearby Homes
- 23-35-21-J No Name
- 6220 Golfview Ave
- 6510 Aspen Ln
- 6177 Brandt St
- 6200 Edison St
- 6115 Allmont St
- 6150 Baltimore Ave
- 6135 Allmont St
- 6555 Corsica Blvd
- 23-35-21-JX-B-2 Aruin St
- 6545 Addie Ave
- 00000 Golfview Ave
- 6085 Edison St
- 6365 Homestead Ave
- 6105 Banyan St
- 6470 Bamboo Ave
- 6665 Addie Ave
- 6010 Fay Blvd
- 0 Golfview Ave
- 6230 Balsam St
Your Personal Tour Guide
Ask me questions while you tour the home.