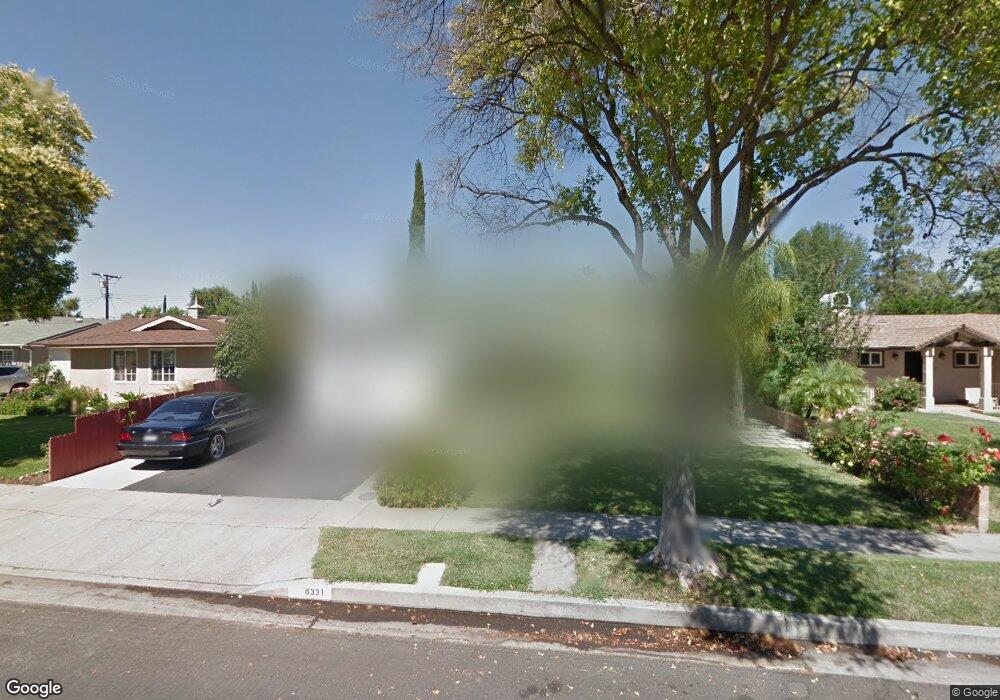
6331 Jackie Ave Woodland Hills, CA 91367
Estimated Value: $1,017,424 - $1,162,000
4
Beds
3
Baths
1,803
Sq Ft
$607/Sq Ft
Est. Value
About This Home
This home is located at 6331 Jackie Ave, Woodland Hills, CA 91367 and is currently estimated at $1,094,856, approximately $607 per square foot. 6331 Jackie Ave is a home located in Los Angeles County with nearby schools including Lockhurst Drive Charter Elementary, Woodlake Elementary Community Charter, and Haynes Charter For Enriched Studies.
Ownership History
Date
Name
Owned For
Owner Type
Purchase Details
Closed on
Nov 26, 2001
Sold by
Mlinarevic Mile
Bought by
Mlinarevic Mile
Current Estimated Value
Home Financials for this Owner
Home Financials are based on the most recent Mortgage that was taken out on this home.
Original Mortgage
$138,000
Outstanding Balance
$54,164
Interest Rate
6.63%
Mortgage Type
Stand Alone First
Estimated Equity
$1,040,692
Purchase Details
Closed on
Apr 22, 1998
Sold by
Richards Carol A
Bought by
Mlinarevic Mile
Home Financials for this Owner
Home Financials are based on the most recent Mortgage that was taken out on this home.
Original Mortgage
$37,250
Interest Rate
7.15%
Purchase Details
Closed on
Nov 6, 1995
Sold by
Misunas Peter
Bought by
Mlinarevic Mile
Home Financials for this Owner
Home Financials are based on the most recent Mortgage that was taken out on this home.
Original Mortgage
$103,500
Interest Rate
7%
Create a Home Valuation Report for This Property
The Home Valuation Report is an in-depth analysis detailing your home's value as well as a comparison with similar homes in the area
Home Values in the Area
Average Home Value in this Area
Purchase History
| Date | Buyer | Sale Price | Title Company |
|---|---|---|---|
| Mlinarevic Mile | -- | Fidelity National Title Co | |
| Mlinarevic Mile | -- | -- | |
| Mlinarevic Mile | $47,090 | Fidelity Title |
Source: Public Records
Mortgage History
| Date | Status | Borrower | Loan Amount |
|---|---|---|---|
| Open | Mlinarevic Mile | $138,000 | |
| Closed | Mlinarevic Mile | $37,250 | |
| Previous Owner | Mlinarevic Mile | $103,500 |
Source: Public Records
Tax History Compared to Growth
Tax History
| Year | Tax Paid | Tax Assessment Tax Assessment Total Assessment is a certain percentage of the fair market value that is determined by local assessors to be the total taxable value of land and additions on the property. | Land | Improvement |
|---|---|---|---|---|
| 2025 | $4,012 | $315,648 | $177,575 | $138,073 |
| 2024 | $4,012 | $309,460 | $174,094 | $135,366 |
| 2023 | $3,938 | $303,393 | $170,681 | $132,712 |
| 2022 | $3,762 | $297,445 | $167,335 | $130,110 |
| 2021 | $3,708 | $291,613 | $164,054 | $127,559 |
| 2019 | $3,601 | $282,966 | $159,189 | $123,777 |
| 2018 | $3,499 | $277,418 | $156,068 | $121,350 |
| 2016 | $3,328 | $266,647 | $150,008 | $116,639 |
| 2015 | $3,281 | $262,642 | $147,755 | $114,887 |
| 2014 | $3,298 | $257,498 | $144,861 | $112,637 |
Source: Public Records
Map
Nearby Homes
- 23432 Victory Blvd
- 23238 Victory Blvd
- 6227 Glide Ave
- 6201 Melba Ave
- 6172 Dalecrest Ave
- 23549 Victory Blvd Unit 21
- 23026 Mobile St
- 6629 Bobbyboyar Ave
- 23201 Oxnard St
- 23123 Oxnard St
- 6236 Kenwater Ave
- 6001 Manton Ave
- 6416 Kenwater Place
- 23416 Califa St
- 6670 Platt Ave
- 23116 Califa St
- 6667 Royer Ave
- 22835 Styles St
- 6814 Berquist Ave
- 23357 Hatteras St
- 6325 Jackie Ave
- 6337 Jackie Ave
- 6319 Jackie Ave
- 6343 Jackie Ave
- 6330 Callicott Ave
- 6336 Callicott Ave
- 6324 Callicott Ave
- 6366 Callicott Ave
- 6342 Callicott Ave
- 6330 Jackie Ave
- 6313 Jackie Ave
- 6318 Callicott Ave
- 6324 Jackie Ave
- 6318 Jackie Ave
- 6344 Jackie Ave
- 6312 Callicott Ave
- 6307 Jackie Ave
- 6312 Jackie Ave
- 23361 Friar St
- 23355 Friar St