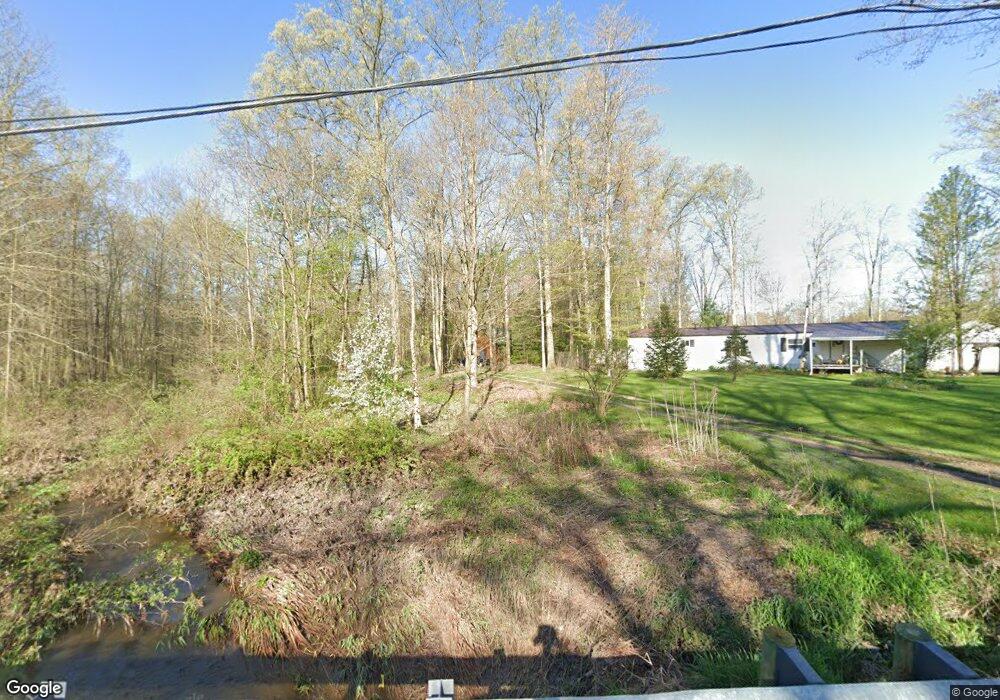
6331 Morrell Ray Rd Bristolville, OH 44402
Estimated Value: $160,000 - $199,000
1
Bed
1
Bath
1,038
Sq Ft
$175/Sq Ft
Est. Value
About This Home
This home is located at 6331 Morrell Ray Rd, Bristolville, OH 44402 and is currently estimated at $181,721, approximately $175 per square foot. 6331 Morrell Ray Rd is a home located in Trumbull County with nearby schools including Maplewood Middle School, Maplewood Elementary School, and Maplewood High School.
Ownership History
Date
Name
Owned For
Owner Type
Purchase Details
Closed on
Jul 31, 2015
Sold by
Barnard Benjamin M and Barnard Tara P
Bought by
Byler Lester A
Current Estimated Value
Home Financials for this Owner
Home Financials are based on the most recent Mortgage that was taken out on this home.
Original Mortgage
$95,101
Outstanding Balance
$74,771
Interest Rate
4.02%
Mortgage Type
VA
Estimated Equity
$106,950
Purchase Details
Closed on
Sep 15, 2011
Sold by
Barnard Benjamin M and Barnard Tara P
Bought by
Barnard Benjamin M and Barnard Tara P
Purchase Details
Closed on
Jun 1, 2009
Sold by
Lawson Fred E
Bought by
Barnard Benjamin M
Home Financials for this Owner
Home Financials are based on the most recent Mortgage that was taken out on this home.
Original Mortgage
$67,918
Interest Rate
4.84%
Mortgage Type
FHA
Create a Home Valuation Report for This Property
The Home Valuation Report is an in-depth analysis detailing your home's value as well as a comparison with similar homes in the area
Home Values in the Area
Average Home Value in this Area
Purchase History
| Date | Buyer | Sale Price | Title Company |
|---|---|---|---|
| Byler Lester A | $93,100 | Title Professionals Inc | |
| Barnard Benjamin M | -- | Attorney | |
| Barnard Benjamin M | $69,200 | Title Professionals Inc |
Source: Public Records
Mortgage History
| Date | Status | Borrower | Loan Amount |
|---|---|---|---|
| Open | Byler Lester A | $95,101 | |
| Previous Owner | Barnard Benjamin M | $67,918 |
Source: Public Records
Tax History Compared to Growth
Tax History
| Year | Tax Paid | Tax Assessment Tax Assessment Total Assessment is a certain percentage of the fair market value that is determined by local assessors to be the total taxable value of land and additions on the property. | Land | Improvement |
|---|---|---|---|---|
| 2024 | $1,853 | $47,950 | $10,920 | $37,030 |
| 2023 | $1,853 | $47,950 | $10,920 | $37,030 |
| 2022 | $1,624 | $37,320 | $9,980 | $27,340 |
| 2021 | $1,713 | $37,320 | $9,980 | $27,340 |
| 2020 | $1,677 | $37,320 | $9,980 | $27,340 |
| 2019 | $1,606 | $34,090 | $9,240 | $24,850 |
| 2018 | $1,597 | $34,090 | $9,240 | $24,850 |
| 2017 | $1,593 | $34,090 | $9,240 | $24,850 |
| 2016 | $1,542 | $33,080 | $8,400 | $24,680 |
| 2015 | $1,495 | $33,080 | $8,400 | $24,680 |
| 2014 | $1,490 | $33,080 | $8,400 | $24,680 |
| 2013 | $1,528 | $33,080 | $8,400 | $24,680 |
Source: Public Records
Map
Nearby Homes
- 475 Greenville Rd NW
- 5634 N Park Ave
- 5294 Cottage Dr
- 5110 N Park Ave
- 2693 Mahan Denman Rd NW
- 634 Bristol Champion Townline Rd NE
- 2684 Griffith Dr
- 2494 Mahan Denman Rd NW
- 6247 Love Warner Rd
- 398 Bristol Champion Townline Rd NW
- 4220 N Park Ave
- 288 Bristol Champion NE
- 3230 Greenville Rd NE
- 8441 State Route 46
- 2271 Peck Leach Rd
- 7434 Fenton Rd NW
- 0 Shaffer Rd NW
- 101 Elizabeth Ct
- 507 Tournament Trail
- 400 Tournament Trail Unit 400
- 5934 Morrell Ray Rd
- 0 Morrell Ray Rd Unit 5026589
- 0 Morrell Ray Rd Unit 5009064
- 0 Morrell Ray Rd Unit 4491435
- 0 Morrell Ray Rd
- 821 State Route 88 NE
- 6349 Morrell Ray Rd
- 570 Greenville Rd NE
- 6381 Morrell Ray Rd
- 862 State Route 88 NE
- 872 State Route 88 NE
- 799 State Route 88 NE
- 799 Greenville Rd NE
- 6391 Morrell Ray Rd
- 822 State Route 88 NE
- 920 Greenville Rd
- 444 State Route 88
- 6269 Morrell Ray Rd
- 939 Greenville Rd
- 789 State Route 88 NE