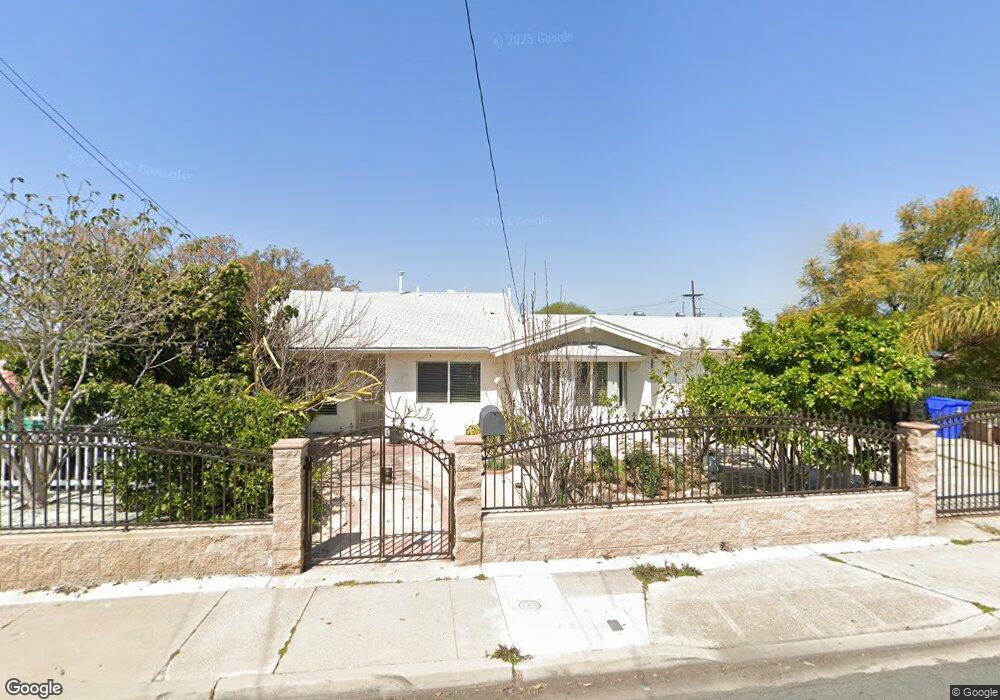
6334 Thorn St San Diego, CA 92115
Oak Park NeighborhoodEstimated Value: $698,815 - $909,000
2
Beds
2
Baths
1,500
Sq Ft
$518/Sq Ft
Est. Value
About This Home
This home is located at 6334 Thorn St, San Diego, CA 92115 and is currently estimated at $776,704, approximately $517 per square foot. 6334 Thorn St is a home located in San Diego County with nearby schools including Carver Elementary School, Mann Middle School, and Crawford High School.
Ownership History
Date
Name
Owned For
Owner Type
Purchase Details
Closed on
May 28, 2024
Sold by
Dam Chi Hong and Doan Yen Ngoc
Bought by
Dam And Doan Living Trust and Dam
Current Estimated Value
Purchase Details
Closed on
Oct 22, 2008
Sold by
Larsen J Farrell
Bought by
Dam Chi Hong and Doan Yen Ngoc
Home Financials for this Owner
Home Financials are based on the most recent Mortgage that was taken out on this home.
Original Mortgage
$162,000
Interest Rate
5.9%
Mortgage Type
Purchase Money Mortgage
Purchase Details
Closed on
Mar 6, 2008
Sold by
Larsen Sharon K
Bought by
Larsen J Farrell
Home Financials for this Owner
Home Financials are based on the most recent Mortgage that was taken out on this home.
Original Mortgage
$221,523
Interest Rate
5.65%
Mortgage Type
FHA
Create a Home Valuation Report for This Property
The Home Valuation Report is an in-depth analysis detailing your home's value as well as a comparison with similar homes in the area
Home Values in the Area
Average Home Value in this Area
Purchase History
| Date | Buyer | Sale Price | Title Company |
|---|---|---|---|
| Dam And Doan Living Trust | -- | None Listed On Document | |
| Dam Chi Hong | $270,000 | Multiple | |
| Larsen J Farrell | -- | Corinthian Title Company | |
| Larsen J Farrell | -- | North American Title Company | |
| Larsen Jess F | $225,000 | North American Title Company |
Source: Public Records
Mortgage History
| Date | Status | Borrower | Loan Amount |
|---|---|---|---|
| Previous Owner | Dam Chi Hong | $162,000 | |
| Previous Owner | Larsen Jess F | $221,523 |
Source: Public Records
Tax History Compared to Growth
Tax History
| Year | Tax Paid | Tax Assessment Tax Assessment Total Assessment is a certain percentage of the fair market value that is determined by local assessors to be the total taxable value of land and additions on the property. | Land | Improvement |
|---|---|---|---|---|
| 2025 | $4,135 | $347,677 | $169,974 | $177,703 |
| 2024 | $4,135 | $340,861 | $166,642 | $174,219 |
| 2023 | $4,042 | $334,178 | $163,375 | $170,803 |
| 2022 | $3,933 | $327,626 | $160,172 | $167,454 |
| 2021 | $3,904 | $321,203 | $157,032 | $164,171 |
| 2020 | $3,856 | $317,910 | $155,422 | $162,488 |
| 2019 | $3,786 | $311,677 | $152,375 | $159,302 |
| 2018 | $3,539 | $305,567 | $149,388 | $156,179 |
| 2017 | $80 | $299,576 | $146,459 | $153,117 |
| 2016 | $3,396 | $293,703 | $143,588 | $150,115 |
| 2015 | $3,345 | $289,293 | $141,432 | $147,861 |
| 2014 | $3,249 | $280,000 | $122,000 | $158,000 |
Source: Public Records
Map
Nearby Homes
- 6310 Thorn St
- 6248 Thorn St
- 6212 Streamview Dr
- 6544 College Grove Dr Unit 68
- 6544 College Grove Dr Unit 71
- 6180 Kerch St
- 3428 Robin St
- 6333 College Grove Way Unit 11102
- 6333 College Grove Way Unit 13106
- 3675 Nassau Dr
- 3955 Faircross Place Unit 60
- 3955 Faircross Place Unit 78
- 5990 Dandridge Ln Unit 198
- 6816 Central Ave Unit 20
- 3966 Vista Grande Dr
- 5985 Dandridge Ln Unit 103
- 5980 Dandridge Ln Unit 215
- 3980 Faircross Place Unit 32
- 3980 Faircross Place Unit 11
- 5763 Streamview Dr