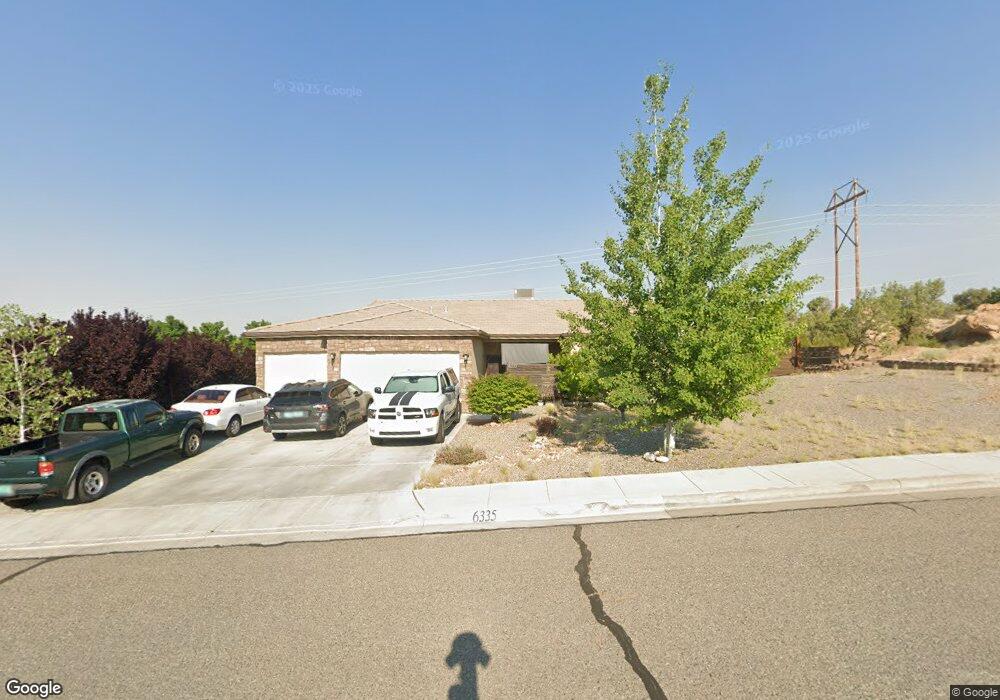
6335 Red Rock Dr Farmington, NM 87402
Estimated Value: $453,000 - $486,000
--
Bed
--
Bath
2,260
Sq Ft
$210/Sq Ft
Est. Value
About This Home
This home is located at 6335 Red Rock Dr, Farmington, NM 87402 and is currently estimated at $473,519, approximately $209 per square foot. 6335 Red Rock Dr is a home with nearby schools including Country Club Elementary School, Heights Middle School, and Piedra Vista High School.
Ownership History
Date
Name
Owned For
Owner Type
Purchase Details
Closed on
Jun 14, 2016
Sold by
Coopers Construction Inc
Bought by
Caruso Michael and Caruso Carol R
Current Estimated Value
Home Financials for this Owner
Home Financials are based on the most recent Mortgage that was taken out on this home.
Original Mortgage
$153,000
Outstanding Balance
$122,127
Interest Rate
3.66%
Mortgage Type
New Conventional
Estimated Equity
$351,392
Purchase Details
Closed on
Sep 5, 2014
Sold by
Griffith Bradley and Griffith Karli
Bought by
Coopers Construction Inc
Purchase Details
Closed on
Mar 21, 2013
Sold by
Griffith Bradley and Griffith Karli
Bought by
Griffith Brad and Griffith Karli
Purchase Details
Closed on
Feb 9, 2013
Sold by
Jackson L Brent and Jackson Katrinna
Bought by
Griffith Bradley and Griffith Karli
Purchase Details
Closed on
May 13, 2010
Sold by
Tabet Tracy and Wright Jeffret
Bought by
Jackson Brent L and Jackson Katrinna
Create a Home Valuation Report for This Property
The Home Valuation Report is an in-depth analysis detailing your home's value as well as a comparison with similar homes in the area
Home Values in the Area
Average Home Value in this Area
Purchase History
| Date | Buyer | Sale Price | Title Company |
|---|---|---|---|
| Caruso Michael | -- | None Available | |
| Coopers Construction Inc | -- | None Available | |
| Griffith Brad | -- | None Available | |
| Griffith Bradley | -- | None Available | |
| Jackson Brent L | -- | None Available |
Source: Public Records
Mortgage History
| Date | Status | Borrower | Loan Amount |
|---|---|---|---|
| Open | Caruso Michael | $153,000 |
Source: Public Records
Tax History Compared to Growth
Tax History
| Year | Tax Paid | Tax Assessment Tax Assessment Total Assessment is a certain percentage of the fair market value that is determined by local assessors to be the total taxable value of land and additions on the property. | Land | Improvement |
|---|---|---|---|---|
| 2024 | $2,932 | $120,735 | $0 | $0 |
| 2023 | $2,870 | $117,219 | $0 | $0 |
| 2022 | $2,736 | $113,805 | $0 | $0 |
| 2021 | $2,635 | $110,490 | $0 | $0 |
| 2020 | $2,590 | $108,882 | $0 | $0 |
| 2019 | $2,542 | $107,421 | $0 | $0 |
| 2018 | $2,611 | $112,378 | $0 | $0 |
| 2017 | $2,578 | $109,823 | $0 | $0 |
| 2016 | $2,508 | $17,250 | $0 | $0 |
| 2015 | $2,466 | $17,250 | $0 | $0 |
| 2014 | $488 | $18,000 | $0 | $0 |
Source: Public Records
Map
Nearby Homes
- 6409 Red Rock Dr
- 5301 Rinconada St
- 5510 Rinconada St
- 5301 Antelope Jct
- NYA Laurel Ct
- 5800 Hogan Ave
- NYA Foothills Dr
- 5607 La Veta Dr
- 5705 N Foothills Dr
- XX Hood Mesa Trail
- 5604 Villa View Dr
- 5603 Lee Ln
- 6505 Sand Ave
- 5507 Budding Ln
- 6341 Spring Ave
- 5713 Pinehurst
- 5403 Angel Place
- 6250 Jack Rabbit Jct
- 6312 Titleist Ct
- 6441 Hawk Eye St
- 6335 Red Rock Dr
- 6331 Red Rock Dr
- 6401 N Red Rock Dr
- 6334 Red Rock Dr
- 6400 Red Rock Dr
- 6405 Red Rock Dr
- 6327 Red Rock Dr
- 6330 Red Rock Dr
- 6404 Red Rock Dr
- 6326 Red Rock Dr
- 6407 Red Rock Ct
- 6413 Red Rock Ct
- 6408 Red Rock Dr
- 6403 Red Rock Ct
- 6417 Red Rock Ct
- 6411 N Red Rock Dr
- 6312 Red Rock Dr
- 6319 N Red Rock Dr
- 6319 Red Rock Dr
- 6421 Red Rock Ct