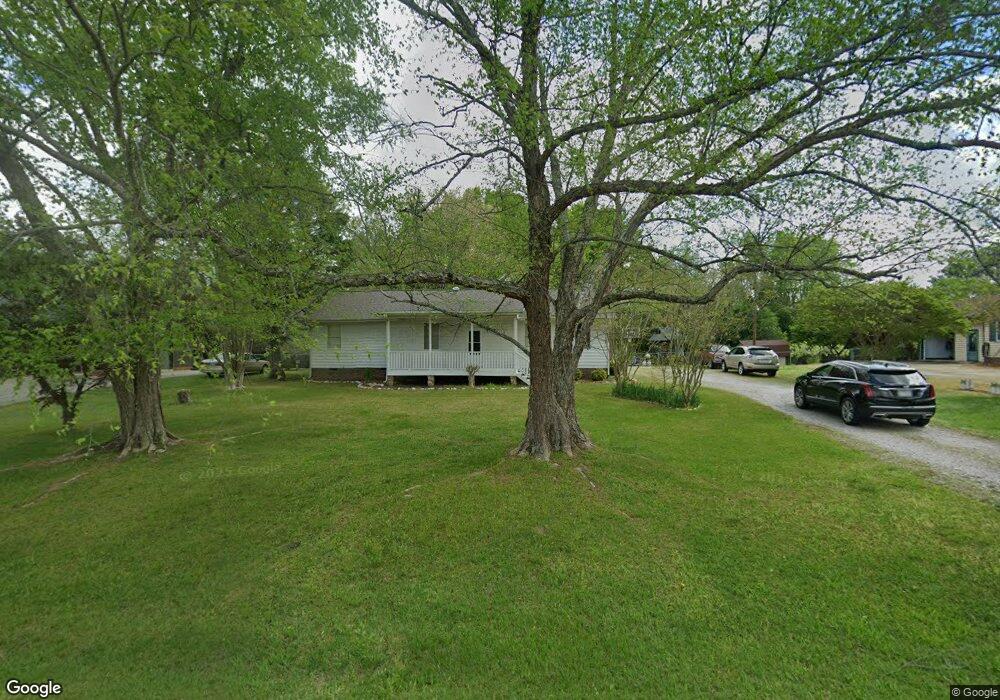
6337 Rock Service Station Rd Raleigh, NC 27603
Estimated Value: $322,000 - $358,130
3
Beds
2
Baths
1,560
Sq Ft
$222/Sq Ft
Est. Value
About This Home
This home is located at 6337 Rock Service Station Rd, Raleigh, NC 27603 and is currently estimated at $346,283, approximately $221 per square foot. 6337 Rock Service Station Rd is a home located in Wake County with nearby schools including Rand Road Elementary, North Garner Middle, and Garner High.
Ownership History
Date
Name
Owned For
Owner Type
Purchase Details
Closed on
Mar 30, 2011
Sold by
Carroll Christopher D
Bought by
Carroll Christopher D and Carroll Melissa E
Current Estimated Value
Home Financials for this Owner
Home Financials are based on the most recent Mortgage that was taken out on this home.
Original Mortgage
$117,000
Outstanding Balance
$80,833
Interest Rate
4.83%
Mortgage Type
New Conventional
Estimated Equity
$265,450
Purchase Details
Closed on
May 25, 2005
Sold by
Adams Billy Ray and Adams Sue R
Bought by
Carroll Christopher D
Home Financials for this Owner
Home Financials are based on the most recent Mortgage that was taken out on this home.
Original Mortgage
$126,003
Interest Rate
5.8%
Mortgage Type
Fannie Mae Freddie Mac
Purchase Details
Closed on
Sep 26, 2003
Sold by
Wrenn Clifton M and Wrenn Sherry R
Bought by
Adams Billy Ray
Create a Home Valuation Report for This Property
The Home Valuation Report is an in-depth analysis detailing your home's value as well as a comparison with similar homes in the area
Home Values in the Area
Average Home Value in this Area
Purchase History
| Date | Buyer | Sale Price | Title Company |
|---|---|---|---|
| Carroll Christopher D | -- | None Available | |
| Carroll Christopher D | $130,000 | -- | |
| Adams Billy Ray | $128,500 | -- |
Source: Public Records
Mortgage History
| Date | Status | Borrower | Loan Amount |
|---|---|---|---|
| Open | Carroll Christopher D | $117,000 | |
| Closed | Carroll Christopher D | $126,003 | |
| Closed | Carroll Christopher D | $3,897 |
Source: Public Records
Tax History Compared to Growth
Tax History
| Year | Tax Paid | Tax Assessment Tax Assessment Total Assessment is a certain percentage of the fair market value that is determined by local assessors to be the total taxable value of land and additions on the property. | Land | Improvement |
|---|---|---|---|---|
| 2025 | $1,989 | $307,779 | $72,000 | $235,779 |
| 2024 | $1,931 | $307,779 | $72,000 | $235,779 |
| 2023 | $1,703 | $215,801 | $36,000 | $179,801 |
| 2022 | $1,579 | $215,801 | $36,000 | $179,801 |
| 2021 | $1,536 | $215,801 | $36,000 | $179,801 |
| 2020 | $1,511 | $215,801 | $36,000 | $179,801 |
| 2019 | $1,335 | $160,994 | $36,000 | $124,994 |
| 2018 | $1,228 | $160,994 | $36,000 | $124,994 |
| 2017 | $1,165 | $160,994 | $36,000 | $124,994 |
| 2016 | $1,141 | $160,994 | $36,000 | $124,994 |
| 2015 | $1,047 | $147,806 | $23,800 | $124,006 |
| 2014 | $993 | $147,806 | $23,800 | $124,006 |
Source: Public Records
Map
Nearby Homes
- 6501 Rock Service Station Rd
- 6600 Rock Service Station Rd
- 1021 Wintu Ct
- 1041 Azalea Garden Cir
- 1045 Azalea Garden Cir
- 1037 Azalea Garden Cir
- 1053 Azalea Garden Cir
- 1033 Azalea Garden Cir
- 1057 Azalea Garden Cir
- 1065 Azalea Garden Cir
- 1061 Azalea Garden Cir
- 1017 Azalea Garden Cir
- 1025 Azalea Garden Cir
- 1069 Azalea Garden Cir
- 6313 Southern Charm Ln
- 6521 Camellia Creek Dr
- 6121 Catandpolly Ln
- 1005 Creek Front Ct
- 936 Elbridge Dr
- 6009 Swales Way
- 6401 Rock Service Station Rd
- 6327 Rock Service Station Rd
- 6405 Rock Service Station Rd
- 6329 Rock Service Station Rd
- 6324 Ribbon Trough Ct
- 6328 Ribbon Trough Ct
- 6320 Ribbon Trough Ct
- 6323 Rock Service Station Rd
- 6407 Rock Service Station Rd
- 6332 Ribbon Trough Ct
- 6400 Rock Service Station Rd
- 6316 Ribbon Trough Ct
- 6321 Rock Service Station Rd
- 6409 Rock Service Station Rd
- 1000 Tyler Farms Dr
- 6336 Ribbon Trough Ct
- 6325 Ribbon Trough Ct
- 6333 Ribbon Trough Ct
- 1004 Tyler Farms Dr
- 6413 Rock Service Station Rd