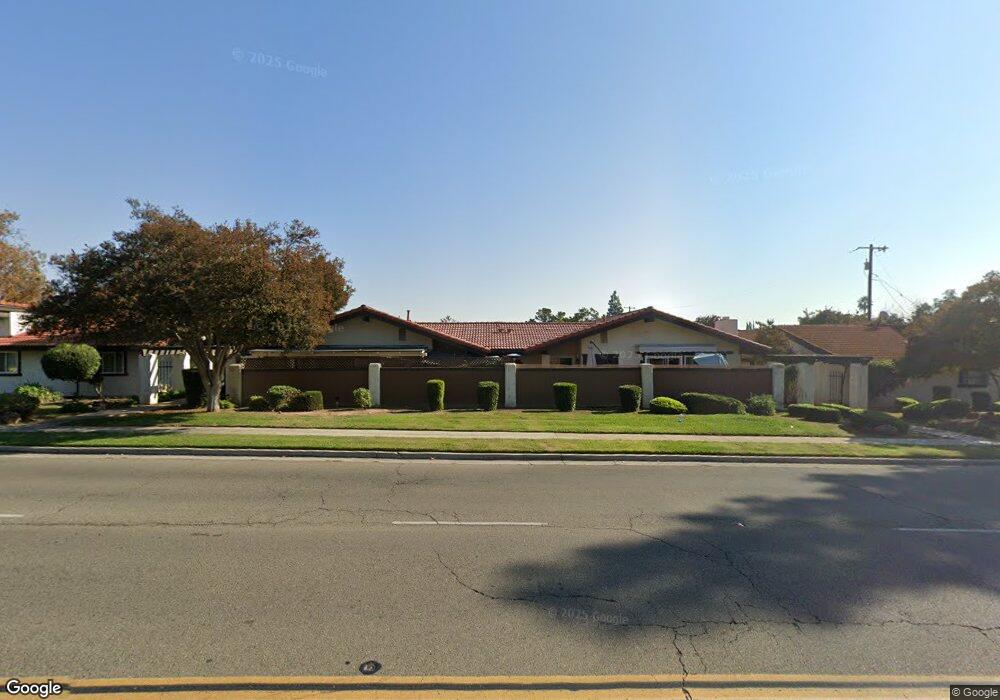
6338 N Maroa Ave Unit 104 Fresno, CA 93704
Bullard NeighborhoodEstimated Value: $219,000 - $274,000
2
Beds
2
Baths
1,244
Sq Ft
$205/Sq Ft
Est. Value
About This Home
This home is located at 6338 N Maroa Ave Unit 104, Fresno, CA 93704 and is currently estimated at $254,508, approximately $204 per square foot. 6338 N Maroa Ave Unit 104 is a home located in Fresno County with nearby schools including Kratt Elementary School, Tenaya Middle School, and Bullard High School.
Ownership History
Date
Name
Owned For
Owner Type
Purchase Details
Closed on
Jun 1, 2011
Sold by
U S Bank National Association
Bought by
Palecek Jan and Palecek Anna
Current Estimated Value
Home Financials for this Owner
Home Financials are based on the most recent Mortgage that was taken out on this home.
Original Mortgage
$43,200
Outstanding Balance
$2,800
Interest Rate
3.84%
Mortgage Type
New Conventional
Estimated Equity
$251,708
Purchase Details
Closed on
Jan 10, 2011
Sold by
Lancaster Lori A
Bought by
Bank Of America National Association
Purchase Details
Closed on
Mar 23, 2000
Sold by
Mark Griffin Ronald and Rene Tamara
Bought by
Lancaster Lori A
Home Financials for this Owner
Home Financials are based on the most recent Mortgage that was taken out on this home.
Original Mortgage
$51,741
Interest Rate
8.24%
Mortgage Type
FHA
Create a Home Valuation Report for This Property
The Home Valuation Report is an in-depth analysis detailing your home's value as well as a comparison with similar homes in the area
Home Values in the Area
Average Home Value in this Area
Purchase History
| Date | Buyer | Sale Price | Title Company |
|---|---|---|---|
| Palecek Jan | $54,000 | Chicago Title Company | |
| Bank Of America National Association | $59,360 | Accommodation | |
| Lancaster Lori A | $53,000 | Stewart Title |
Source: Public Records
Mortgage History
| Date | Status | Borrower | Loan Amount |
|---|---|---|---|
| Open | Palecek Jan | $43,200 | |
| Previous Owner | Lancaster Lori A | $51,741 |
Source: Public Records
Tax History Compared to Growth
Tax History
| Year | Tax Paid | Tax Assessment Tax Assessment Total Assessment is a certain percentage of the fair market value that is determined by local assessors to be the total taxable value of land and additions on the property. | Land | Improvement |
|---|---|---|---|---|
| 2025 | $914 | $69,169 | $16,648 | $52,521 |
| 2023 | $863 | $66,485 | $16,002 | $50,483 |
| 2022 | $851 | $65,183 | $15,689 | $49,494 |
| 2021 | $828 | $63,906 | $15,382 | $48,524 |
| 2020 | $825 | $63,252 | $15,225 | $48,027 |
| 2019 | $794 | $62,013 | $14,927 | $47,086 |
| 2018 | $777 | $60,798 | $14,635 | $46,163 |
| 2017 | $764 | $59,607 | $14,349 | $45,258 |
| 2016 | $739 | $58,439 | $14,068 | $44,371 |
| 2015 | $728 | $57,562 | $13,857 | $43,705 |
| 2014 | $715 | $56,435 | $13,586 | $42,849 |
Source: Public Records
Map
Nearby Homes
- 317 W Sierra Ave Unit 124
- 317 W Sierra Ave Unit 107
- 411 W Vartikian Ave
- 6164 N Maroa Ave
- 365 W Escalon Ave
- 231 W Paul Ave
- 6284 N Del Mar Ave
- 6300 N Palm Ave Unit 109
- 6607 N Maroa Ave
- 516 W Palo Alto Ave
- 6260 N Palm Ave Unit 111
- 573 W Fremont Ave
- 665 W Escalon Ave
- 6048 N Del Mar Ave
- 6171 N Calaveras St
- 333 W Bullard Ave Unit 103
- 221 W Herndon Ave Unit 120
- 221 W Herndon Ave Unit 87
- 221 W Herndon Ave Unit 59
- 221 W Herndon Ave Unit 49
- 6338 N Maroa Ave
- 6338 N Maroa Ave Unit 106
- 6338 N Maroa Ave Unit 105
- 6338 N Maroa Ave Unit 112
- 6338 N Maroa Ave Unit 113
- 6338 N Maroa Ave Unit 114
- 6338 N Maroa Ave Unit 117
- 6338 N Maroa Ave Unit 118
- 6338 N Maroa Ave Unit 119
- 6338 N Maroa Ave Unit 101
- 6338 N Maroa Ave Unit 102
- 6338 N Maroa Ave Unit 103
- 6338 N Maroa Ave Unit 111
- 6338 N Maroa Ave Unit 110
- 6338 N Maroa Ave Unit 109
- 6338 N Maroa Ave Unit 108
- 6338 N Maroa Ave Unit 107
- 390 W Ellery Way
- 374 W Ellery Way
- 362 W Ellery Way