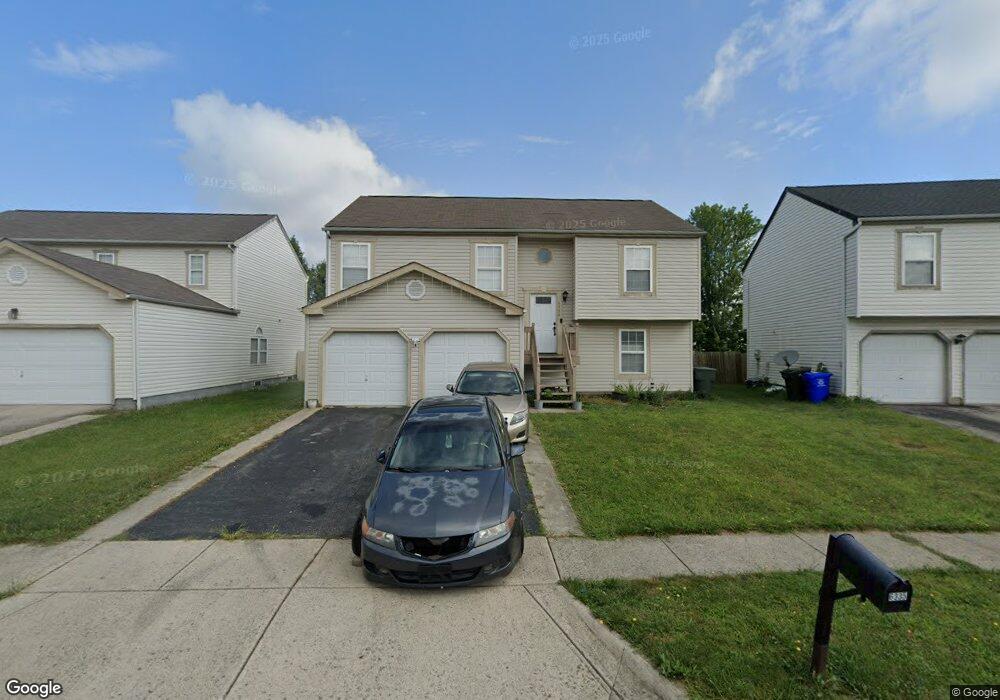
6338 Pritchard Dr Galloway, OH 43119
Westbend NeighborhoodEstimated Value: $300,000 - $318,000
4
Beds
3
Baths
1,968
Sq Ft
$158/Sq Ft
Est. Value
About This Home
This home is located at 6338 Pritchard Dr, Galloway, OH 43119 and is currently estimated at $311,168, approximately $158 per square foot. 6338 Pritchard Dr is a home located in Franklin County with nearby schools including Georgian Heights Alt Elementary School, Wedgewood Middle School, and Briggs High School.
Ownership History
Date
Name
Owned For
Owner Type
Purchase Details
Closed on
Jul 21, 2020
Sold by
Alford John and Alford Curtisha
Bought by
Martinez Hector B
Current Estimated Value
Home Financials for this Owner
Home Financials are based on the most recent Mortgage that was taken out on this home.
Original Mortgage
$195,395
Outstanding Balance
$172,939
Interest Rate
3%
Mortgage Type
FHA
Estimated Equity
$138,229
Purchase Details
Closed on
Dec 21, 2007
Sold by
Lee Lewis Suzanne and Lee Grant William
Bought by
Thomas Curtisha and Alford John
Home Financials for this Owner
Home Financials are based on the most recent Mortgage that was taken out on this home.
Original Mortgage
$140,000
Interest Rate
6.27%
Mortgage Type
Purchase Money Mortgage
Purchase Details
Closed on
May 28, 2003
Sold by
Maronda Homes Inc
Bought by
Lewis Suzanne
Create a Home Valuation Report for This Property
The Home Valuation Report is an in-depth analysis detailing your home's value as well as a comparison with similar homes in the area
Home Values in the Area
Average Home Value in this Area
Purchase History
| Date | Buyer | Sale Price | Title Company |
|---|---|---|---|
| Martinez Hector B | $199,000 | Heart Of Gold Title | |
| Thomas Curtisha | $140,000 | Land Sel Ti | |
| Lewis Suzanne | $138,700 | Chicago Title |
Source: Public Records
Mortgage History
| Date | Status | Borrower | Loan Amount |
|---|---|---|---|
| Open | Martinez Hector B | $195,395 | |
| Previous Owner | Thomas Curtisha | $140,000 |
Source: Public Records
Tax History Compared to Growth
Tax History
| Year | Tax Paid | Tax Assessment Tax Assessment Total Assessment is a certain percentage of the fair market value that is determined by local assessors to be the total taxable value of land and additions on the property. | Land | Improvement |
|---|---|---|---|---|
| 2024 | $3,699 | $82,430 | $25,200 | $57,230 |
| 2023 | $3,652 | $82,425 | $25,200 | $57,225 |
| 2022 | $3,005 | $57,930 | $9,240 | $48,690 |
| 2021 | $3,068 | $57,930 | $9,240 | $48,690 |
| 2020 | $3,014 | $57,930 | $9,240 | $48,690 |
| 2019 | $2,924 | $48,200 | $7,700 | $40,500 |
| 2018 | $2,782 | $48,200 | $7,700 | $40,500 |
| 2017 | $2,918 | $48,200 | $7,700 | $40,500 |
| 2016 | $2,915 | $44,000 | $7,600 | $36,400 |
| 2015 | $2,646 | $44,000 | $7,600 | $36,400 |
| 2014 | $2,652 | $44,000 | $7,600 | $36,400 |
| 2013 | $1,377 | $46,305 | $7,980 | $38,325 |
Source: Public Records
Map
Nearby Homes
- 976 Meadow Downs Trail
- 6317 Oak Trail Dr
- 6351 Greenhaven Ave
- 6567 Hall Rd
- 6532 Birch Park Dr
- 669 Gleaming Dr Unit 248
- 6109 Nasby Dr
- 813 Sumter St
- 634 Gleaming Dr Unit 180
- 6059 Chidley St
- 603 Gleaming Dr Unit 259
- 1058 Rousseau Ln
- 6699 Hall Rd
- 6024 Winterberry Dr
- 843 Spivey Ln
- 1418 Tilia Ct
- 844 Spivey Ln
- 332 Rye St Unit Lot 53
- 320 Rye St Unit Lot 51
- 315 Rye St Unit Lot 121
- 6328 Pritchard Dr
- 6344 Pritchard Dr
- 6320 Pritchard Dr
- 6160 Hall Rd
- 6335 Pritchard Dr
- 6323 Pritchard Dr
- 6343 Pritchard Dr
- 6343 Pritchard Dr Unit 39
- 6312 Pritchard Dr
- 907 Drayson Dr
- 6351 Pritchard Dr
- 6307 Pritchard Dr
- 908 Drayson Dr
- 6304 Pritchard Dr
- 915 Drayson Dr
- 941 Okatie Dr
- 916 Drayson Dr
- 6296 Pritchard Dr
- 949 Okatie Dr
- 923 Drayson Dr