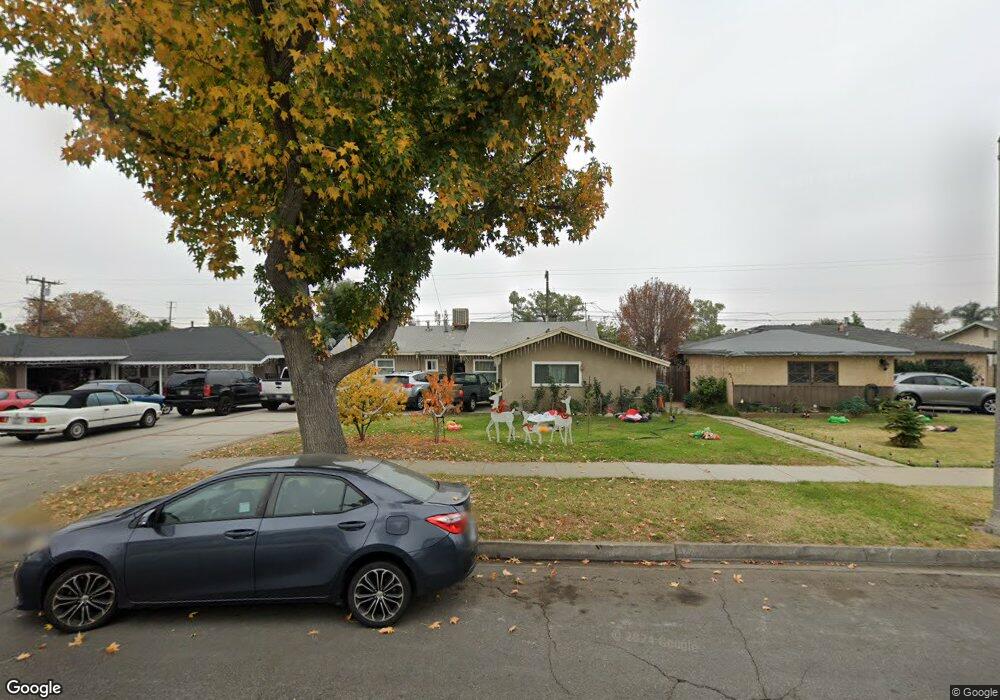
634 E Yale St Ontario, CA 91764
Downtown Ontario NeighborhoodEstimated Value: $666,000 - $735,000
4
Beds
2
Baths
1,300
Sq Ft
$536/Sq Ft
Est. Value
About This Home
This home is located at 634 E Yale St, Ontario, CA 91764 and is currently estimated at $697,160, approximately $536 per square foot. 634 E Yale St is a home located in San Bernardino County with nearby schools including Edison Elementary School, Vina Danks Middle, and Chaffey High School.
Ownership History
Date
Name
Owned For
Owner Type
Purchase Details
Closed on
Jan 30, 2021
Sold by
Diaz Jose M
Bought by
Chavez J Dolores J and Chavez Maria D
Current Estimated Value
Home Financials for this Owner
Home Financials are based on the most recent Mortgage that was taken out on this home.
Original Mortgage
$159,900
Outstanding Balance
$143,454
Interest Rate
2.88%
Mortgage Type
New Conventional
Estimated Equity
$553,706
Purchase Details
Closed on
Apr 9, 2020
Sold by
Diaz Jose M
Bought by
Chavez J Dolorez J and Chavez Maria D
Purchase Details
Closed on
Oct 13, 2008
Sold by
Us Bank National Association
Bought by
Diaz Jose M
Home Financials for this Owner
Home Financials are based on the most recent Mortgage that was taken out on this home.
Original Mortgage
$192,460
Interest Rate
5.9%
Mortgage Type
FHA
Purchase Details
Closed on
Jul 14, 2008
Sold by
Mondragon Israel
Bought by
Us Bank Na and Bear Stearns Asset Backed Securities I T
Purchase Details
Closed on
Nov 29, 2005
Sold by
Vega Arturo M
Bought by
Mondragon Israel
Home Financials for this Owner
Home Financials are based on the most recent Mortgage that was taken out on this home.
Original Mortgage
$79,200
Interest Rate
6.07%
Mortgage Type
Stand Alone Second
Purchase Details
Closed on
Nov 21, 2005
Sold by
Mondragon Israel
Bought by
Mondragon Israel and Mondragon Silvia G
Home Financials for this Owner
Home Financials are based on the most recent Mortgage that was taken out on this home.
Original Mortgage
$79,200
Interest Rate
6.07%
Mortgage Type
Stand Alone Second
Purchase Details
Closed on
Jun 4, 1999
Sold by
Hebb Richard
Bought by
Vega Arturo M and Martinez Nancy A
Home Financials for this Owner
Home Financials are based on the most recent Mortgage that was taken out on this home.
Original Mortgage
$125,961
Interest Rate
6.9%
Mortgage Type
FHA
Purchase Details
Closed on
May 20, 1999
Sold by
Villanueva Alejandra
Bought by
Vega Arturo M
Home Financials for this Owner
Home Financials are based on the most recent Mortgage that was taken out on this home.
Original Mortgage
$125,961
Interest Rate
6.9%
Mortgage Type
FHA
Purchase Details
Closed on
Sep 19, 1997
Sold by
Furois Mary C
Bought by
Hebb Richard
Purchase Details
Closed on
Jun 23, 1997
Sold by
Robbins Rob
Bought by
Furois Mary Celestine
Home Financials for this Owner
Home Financials are based on the most recent Mortgage that was taken out on this home.
Original Mortgage
$40,000
Interest Rate
7.91%
Create a Home Valuation Report for This Property
The Home Valuation Report is an in-depth analysis detailing your home's value as well as a comparison with similar homes in the area
Home Values in the Area
Average Home Value in this Area
Purchase History
| Date | Buyer | Sale Price | Title Company |
|---|---|---|---|
| Chavez J Dolores J | -- | Amrock Llc | |
| Chavez J Dolorez J | -- | Orange Coast Title Company | |
| Diaz Jose M | $195,000 | None Available | |
| Us Bank Na | $234,000 | Accommodation | |
| Mondragon Israel | $396,000 | Ticor Title Company | |
| Mondragon Israel | -- | -- | |
| Mondragon Israel | -- | Ticor Title Company | |
| Vega Arturo M | $127,000 | Old Republic Title Company | |
| Vega Arturo M | -- | Old Republic Title Company | |
| Hebb Richard | -- | North American Title Co | |
| Furois Mary Celestine | -- | North American Title Co |
Source: Public Records
Mortgage History
| Date | Status | Borrower | Loan Amount |
|---|---|---|---|
| Open | Chavez J Dolores J | $159,900 | |
| Closed | Diaz Jose M | $192,460 | |
| Previous Owner | Mondragon Israel | $79,200 | |
| Previous Owner | Mondragon Israel | $316,800 | |
| Previous Owner | Vega Arturo M | $125,961 | |
| Previous Owner | Furois Mary Celestine | $40,000 |
Source: Public Records
Tax History
| Year | Tax Paid | Tax Assessment Tax Assessment Total Assessment is a certain percentage of the fair market value that is determined by local assessors to be the total taxable value of land and additions on the property. | Land | Improvement |
|---|---|---|---|---|
| 2025 | $6,645 | $604,889 | $212,242 | $392,647 |
| 2024 | $6,494 | $593,028 | $208,080 | $384,948 |
| 2023 | $6,312 | $581,400 | $204,000 | $377,400 |
| 2022 | $6,228 | $570,000 | $200,000 | $370,000 |
| 2021 | $2,583 | $231,990 | $83,277 | $148,713 |
| 2020 | $2,537 | $229,611 | $82,423 | $147,188 |
| 2019 | $2,516 | $225,109 | $80,807 | $144,302 |
| 2018 | $2,481 | $220,696 | $79,223 | $141,473 |
| 2017 | $2,392 | $216,369 | $77,670 | $138,699 |
| 2016 | $2,298 | $212,126 | $76,147 | $135,979 |
| 2015 | $2,283 | $208,939 | $75,003 | $133,936 |
| 2014 | $2,211 | $204,846 | $73,534 | $131,312 |
Source: Public Records
Map
Nearby Homes
- 640 E Yale St
- 630 E Yale St
- 646 E Yale St
- 624 E Yale St
- 633 E Princeton St
- 639 E Princeton St
- 641 E Princeton St
- 627 E Princeton St
- 643 E Princeton St
- 652 E Yale St
- 618 E Yale St
- 621 E Princeton St
- 633 E Yale St
- 639 E Yale St
- 627 E Yale St
- 649 E Princeton St
- 647 E Yale St
- 621 E Yale St
- 615 E Princeton St
- 658 E Yale St
Your Personal Tour Guide
Ask me questions while you tour the home.