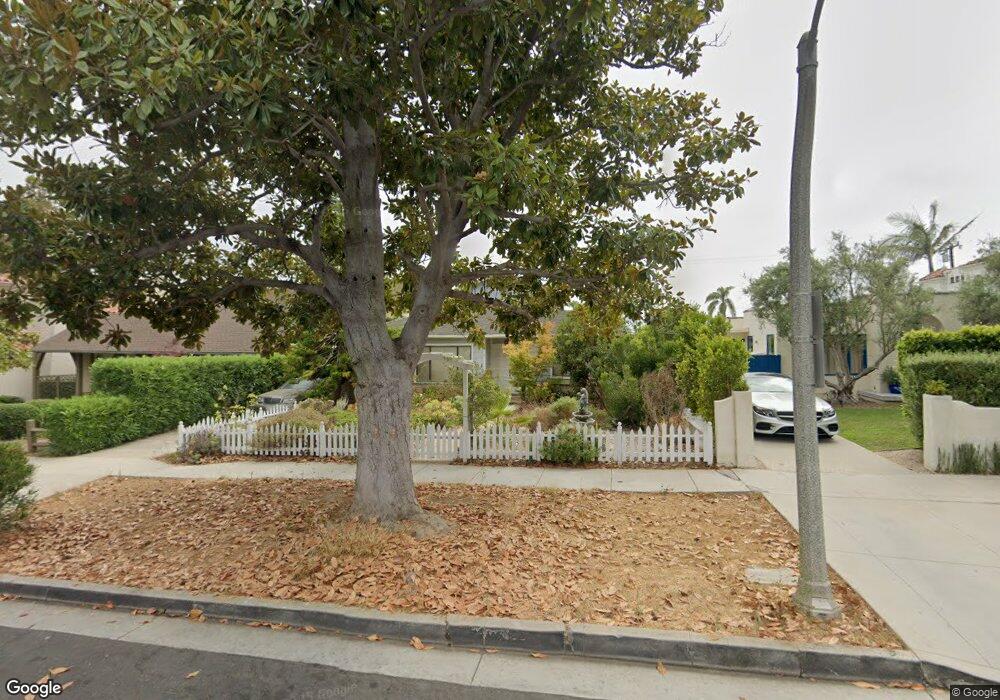
634 Euclid St Santa Monica, CA 90402
North of Montana NeighborhoodEstimated Value: $3,823,000 - $4,223,000
3
Beds
2
Baths
1,965
Sq Ft
$2,045/Sq Ft
Est. Value
About This Home
This home is located at 634 Euclid St, Santa Monica, CA 90402 and is currently estimated at $4,019,256, approximately $2,045 per square foot. 634 Euclid St is a home located in Los Angeles County with nearby schools including Roosevelt Elementary School, Lincoln Middle School, and Santa Monica High School.
Ownership History
Date
Name
Owned For
Owner Type
Purchase Details
Closed on
Jun 21, 2021
Sold by
Ajemian Antaram
Bought by
Ajemian Abraham
Current Estimated Value
Home Financials for this Owner
Home Financials are based on the most recent Mortgage that was taken out on this home.
Original Mortgage
$0
Interest Rate
2.9%
Mortgage Type
New Conventional
Purchase Details
Closed on
Jun 11, 2021
Sold by
Revo Abraham and Revo Antaram
Bought by
Ajemian Abraham
Home Financials for this Owner
Home Financials are based on the most recent Mortgage that was taken out on this home.
Original Mortgage
$0
Interest Rate
2.9%
Mortgage Type
New Conventional
Purchase Details
Closed on
Sep 13, 2002
Sold by
Ajemian Abraham
Bought by
Ajemian Abraham and Ajemian Antaram
Home Financials for this Owner
Home Financials are based on the most recent Mortgage that was taken out on this home.
Original Mortgage
$300,000
Interest Rate
6.24%
Purchase Details
Closed on
Sep 23, 1999
Sold by
Ajemian Abraham
Bought by
Ajemian Abraham and Ajemian Antaram
Create a Home Valuation Report for This Property
The Home Valuation Report is an in-depth analysis detailing your home's value as well as a comparison with similar homes in the area
Home Values in the Area
Average Home Value in this Area
Purchase History
| Date | Buyer | Sale Price | Title Company |
|---|---|---|---|
| Ajemian Abraham | -- | Fidelity National Title | |
| Ajemian Abraham | -- | Fidelity National Title | |
| Ajemian Abraham | -- | Provident Title | |
| Ajemian Abraham | -- | Provident Title | |
| Ajemian Abraham | -- | -- |
Source: Public Records
Mortgage History
| Date | Status | Borrower | Loan Amount |
|---|---|---|---|
| Closed | Ajemian Abraham | $0 | |
| Open | Ajemian Abraham | $1,800,000 | |
| Previous Owner | Ajemian Abraham | $300,000 |
Source: Public Records
Tax History Compared to Growth
Tax History
| Year | Tax Paid | Tax Assessment Tax Assessment Total Assessment is a certain percentage of the fair market value that is determined by local assessors to be the total taxable value of land and additions on the property. | Land | Improvement |
|---|---|---|---|---|
| 2025 | $2,781 | $213,540 | $126,969 | $86,571 |
| 2024 | $2,781 | $209,354 | $124,480 | $84,874 |
| 2023 | $2,742 | $205,250 | $122,040 | $83,210 |
| 2022 | $2,707 | $201,227 | $119,648 | $81,579 |
| 2021 | $2,627 | $197,282 | $117,302 | $79,980 |
| 2020 | $2,607 | $195,260 | $116,100 | $79,160 |
| 2019 | $2,581 | $191,432 | $113,824 | $77,608 |
| 2018 | $2,348 | $187,680 | $111,593 | $76,087 |
| 2016 | $2,239 | $180,394 | $107,260 | $73,134 |
| 2015 | $2,210 | $177,685 | $105,649 | $72,036 |
| 2014 | $2,192 | $174,205 | $103,580 | $70,625 |
Source: Public Records
Map
Nearby Homes
- 723 14th St
- 728 11th St
- 827 12th St
- 548 15th St
- 831 14th St Unit 2
- 443 Euclid St
- 837 11th St Unit 7
- 618 10th St
- 858 12th St Unit 4
- 900 Euclid St Unit 404
- 713 9th St Unit 3
- 511 9th St
- 937 12th St Unit 308
- 852 10th St Unit 1
- 925 14th St Unit 20
- 933 11th St Unit 21
- 428 10th St
- 627 17th St
- 838 17th St Unit 105
- 837 Lincoln Blvd Unit 6