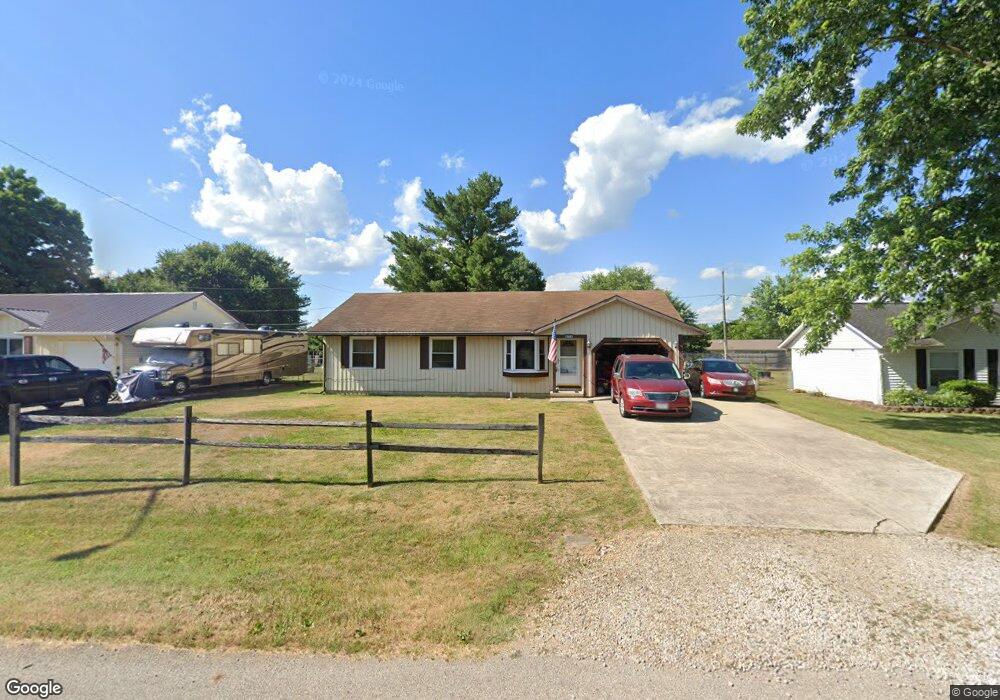
634 Franklin Cir Chillicothe, OH 45601
Estimated Value: $187,000 - $220,139
6
Beds
2
Baths
1,260
Sq Ft
$158/Sq Ft
Est. Value
About This Home
This home is located at 634 Franklin Cir, Chillicothe, OH 45601 and is currently estimated at $199,285, approximately $158 per square foot. 634 Franklin Cir is a home located in Ross County with nearby schools including Paint Valley Elementary School, Paint Valley Middle School, and Paint Valley High School.
Ownership History
Date
Name
Owned For
Owner Type
Purchase Details
Closed on
Mar 10, 2025
Sold by
Parks John R
Bought by
Davis Stephen G and Davis Kathy D
Current Estimated Value
Purchase Details
Closed on
Jan 20, 2012
Sold by
Secretary Of Veterans Affairs
Bought by
Parks John R
Purchase Details
Closed on
Sep 12, 2011
Sold by
Hyde Terry F
Bought by
Secretary Of Veterans Affairs
Purchase Details
Closed on
Jun 6, 2008
Sold by
Fratarelli Saturnina
Bought by
Hyde Terry F
Home Financials for this Owner
Home Financials are based on the most recent Mortgage that was taken out on this home.
Original Mortgage
$110,000
Interest Rate
6.04%
Mortgage Type
VA
Purchase Details
Closed on
Oct 19, 2007
Sold by
Rogers Tawna Jayne and Rogers Kim
Bought by
Fratarelli Saturnina
Home Financials for this Owner
Home Financials are based on the most recent Mortgage that was taken out on this home.
Original Mortgage
$72,400
Interest Rate
6.5%
Mortgage Type
Purchase Money Mortgage
Create a Home Valuation Report for This Property
The Home Valuation Report is an in-depth analysis detailing your home's value as well as a comparison with similar homes in the area
Home Values in the Area
Average Home Value in this Area
Purchase History
| Date | Buyer | Sale Price | Title Company |
|---|---|---|---|
| Davis Stephen G | $175,000 | None Listed On Document | |
| Davis Stephen G | $175,000 | None Listed On Document | |
| Parks John R | $49,500 | State Title | |
| Secretary Of Veterans Affairs | $79,317 | Attorney | |
| Hyde Terry F | $110,000 | Professional Closing Title A | |
| Fratarelli Saturnina | $90,500 | Chicago Title Of Ross County |
Source: Public Records
Mortgage History
| Date | Status | Borrower | Loan Amount |
|---|---|---|---|
| Previous Owner | Hyde Terry F | $110,000 | |
| Previous Owner | Fratarelli Saturnina | $72,400 |
Source: Public Records
Tax History Compared to Growth
Tax History
| Year | Tax Paid | Tax Assessment Tax Assessment Total Assessment is a certain percentage of the fair market value that is determined by local assessors to be the total taxable value of land and additions on the property. | Land | Improvement |
|---|---|---|---|---|
| 2024 | $1,579 | $42,770 | $5,850 | $36,920 |
| 2023 | $1,579 | $42,770 | $5,850 | $36,920 |
| 2022 | $1,549 | $42,770 | $5,850 | $36,920 |
| 2021 | $1,265 | $32,490 | $4,460 | $28,030 |
| 2020 | $1,268 | $32,490 | $4,460 | $28,030 |
| 2019 | $1,245 | $32,490 | $4,460 | $28,030 |
| 2018 | $1,115 | $28,300 | $4,460 | $23,840 |
| 2017 | $1,103 | $27,960 | $4,460 | $23,500 |
| 2016 | $1,076 | $27,960 | $4,460 | $23,500 |
| 2015 | $1,034 | $26,840 | $4,460 | $22,380 |
| 2014 | $1,010 | $26,840 | $4,460 | $22,380 |
| 2013 | $1,027 | $26,840 | $4,460 | $22,380 |
Source: Public Records
Map
Nearby Homes
- 102 Franklin Cir
- 263 Queen Dr
- 313 Goodale Dr
- 54 Moccasin Dr
- 365 Golfview Dr
- 559 Golfview Dr
- 2083 Anderson Station Rd
- 70 W Patrician Ct
- 18 Sarah Ct
- 320 Summerhill Dr
- 11303 County Road 550
- 435 Mount Carmel Rd
- 420 Steiner Rd
- 12690 Pleasant Valley Rd
- 2719 Sulphur Lick Rd
- 310 Almahurst Dr
- 155 Steiner Rd
- 13223 Pleasant Valley Rd
- 88 Fruit Hill Dr
- 63 Page Rd