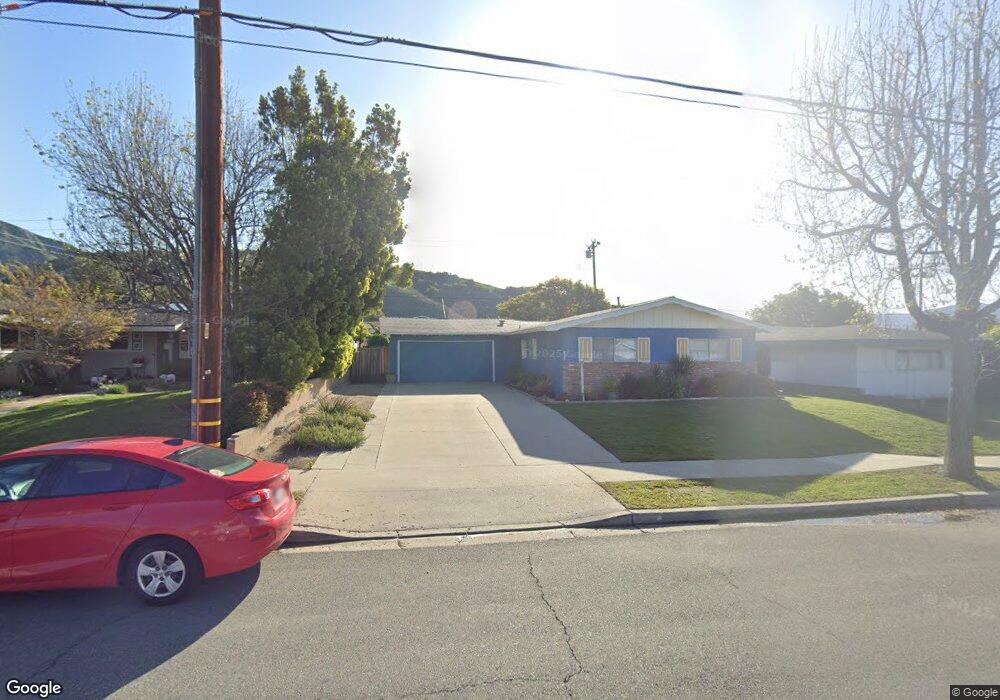
634 Mountain View St Fillmore, CA 93015
Estimated Value: $607,000 - $655,000
3
Beds
2
Baths
1,233
Sq Ft
$514/Sq Ft
Est. Value
About This Home
This home is located at 634 Mountain View St, Fillmore, CA 93015 and is currently estimated at $633,967, approximately $514 per square foot. 634 Mountain View St is a home located in Ventura County with nearby schools including San Cayetano Elementary School and Fillmore Senior High.
Ownership History
Date
Name
Owned For
Owner Type
Purchase Details
Closed on
Jan 20, 2020
Sold by
Pimentel Jennifer A
Bought by
Pimentel Jennifer and Jennifer Pimentel Living Trust
Current Estimated Value
Purchase Details
Closed on
Mar 24, 2016
Sold by
Pimentel Curtis A
Bought by
Pimentel Jennifer A
Home Financials for this Owner
Home Financials are based on the most recent Mortgage that was taken out on this home.
Original Mortgage
$301,841
Outstanding Balance
$244,463
Interest Rate
4.37%
Mortgage Type
FHA
Estimated Equity
$389,504
Purchase Details
Closed on
May 18, 2010
Sold by
Deutsche Bank National Trust Company
Bought by
Pimentel Curtis A and Pimentel Jennifer A
Home Financials for this Owner
Home Financials are based on the most recent Mortgage that was taken out on this home.
Original Mortgage
$256,446
Interest Rate
4.75%
Mortgage Type
FHA
Purchase Details
Closed on
Apr 1, 2010
Sold by
Parker Vincent Hutson
Bought by
Deutsche Bank National Trust Company
Home Financials for this Owner
Home Financials are based on the most recent Mortgage that was taken out on this home.
Original Mortgage
$256,446
Interest Rate
4.75%
Mortgage Type
FHA
Purchase Details
Closed on
Mar 27, 2003
Sold by
Cendant Mobility Financial Corp
Bought by
Parker Vincent Hutson
Home Financials for this Owner
Home Financials are based on the most recent Mortgage that was taken out on this home.
Original Mortgage
$237,200
Interest Rate
6.5%
Purchase Details
Closed on
Mar 6, 2003
Sold by
Parker Kimberly
Bought by
Parker Vincent Hutson
Home Financials for this Owner
Home Financials are based on the most recent Mortgage that was taken out on this home.
Original Mortgage
$237,200
Interest Rate
6.5%
Purchase Details
Closed on
Jan 23, 2003
Sold by
Starr Thomas D
Bought by
Cendant Mobility Financial Corp
Purchase Details
Closed on
Sep 16, 2002
Sold by
Starr Lonni
Bought by
Starr Thomas D
Home Financials for this Owner
Home Financials are based on the most recent Mortgage that was taken out on this home.
Original Mortgage
$228,000
Interest Rate
4.75%
Purchase Details
Closed on
Feb 18, 1997
Sold by
Poling Martin L and Poling Arlene R
Bought by
Yale Marc L and Yale Beth C
Home Financials for this Owner
Home Financials are based on the most recent Mortgage that was taken out on this home.
Original Mortgage
$109,600
Interest Rate
7.66%
Create a Home Valuation Report for This Property
The Home Valuation Report is an in-depth analysis detailing your home's value as well as a comparison with similar homes in the area
Home Values in the Area
Average Home Value in this Area
Purchase History
| Date | Buyer | Sale Price | Title Company |
|---|---|---|---|
| Pimentel Jennifer | -- | None Available | |
| Pimentel Jennifer A | -- | Chicago Title Co | |
| Pimentel Curtis A | $260,000 | Multiple | |
| Deutsche Bank National Trust Company | $228,000 | Accommodation | |
| Parker Vincent Hutson | $296,500 | Equity Title Company | |
| Parker Vincent Hutson | -- | Equity Title Company | |
| Cendant Mobility Financial Corp | -- | Equity Title Company | |
| Starr Thomas D | -- | Old Republic Title Ins Compa | |
| Starr Thomas D | $285,000 | Old Republic Title Ins Compa | |
| Yale Marc L | $137,000 | Old Republic Title Company |
Source: Public Records
Mortgage History
| Date | Status | Borrower | Loan Amount |
|---|---|---|---|
| Open | Pimentel Jennifer A | $301,841 | |
| Closed | Pimentel Curtis A | $256,446 | |
| Previous Owner | Parker Vincent Hutson | $237,200 | |
| Previous Owner | Starr Thomas D | $228,000 | |
| Previous Owner | Starr Thomas D | $42,700 | |
| Previous Owner | Yale Marc L | $109,600 | |
| Closed | Parker Vincent Hutson | $59,300 |
Source: Public Records
Tax History
| Year | Tax Paid | Tax Assessment Tax Assessment Total Assessment is a certain percentage of the fair market value that is determined by local assessors to be the total taxable value of land and additions on the property. | Land | Improvement |
|---|---|---|---|---|
| 2025 | $3,659 | $335,467 | $167,734 | $167,733 |
| 2024 | $3,659 | $328,890 | $164,445 | $164,445 |
| 2023 | $3,608 | $322,442 | $161,221 | $161,221 |
| 2022 | $3,335 | $316,120 | $158,060 | $158,060 |
| 2021 | $3,790 | $309,922 | $154,961 | $154,961 |
| 2020 | $3,515 | $306,746 | $153,373 | $153,373 |
| 2019 | $3,524 | $300,732 | $150,366 | $150,366 |
| 2018 | $3,452 | $294,836 | $147,418 | $147,418 |
| 2017 | $3,471 | $289,056 | $144,528 | $144,528 |
| 2016 | $3,213 | $283,390 | $141,695 | $141,695 |
| 2015 | $3,122 | $279,134 | $139,567 | $139,567 |
| 2014 | $3,119 | $273,668 | $136,834 | $136,834 |
Source: Public Records
Map
Nearby Homes
- 639 Mountain View St
- 616 Island View St
- 318 Bard St
- 345 Blaine Ave
- 404 Central Ave
- 340 Central Ave
- 809 Woodgrove Rd
- 815 Woodgrove Rd
- 252 Driftwood St
- 199 Rosewood St
- 81 Wildwood Ln
- 831 Blaine Ave
- 309 Heritage Valley Pkwy
- 915 E Telegraph Rd
- 458 Edgewood Dr
- 513 Heritage Valley Pkwy
- 549 Heritage Valley Pkwy
- 250 E Telegraph Rd Unit 200
- 250 E Telegraph Rd Unit 68
- 250 E Telegraph Rd Unit 135
- 642 Mountain View St
- 628 Mountain View St
- 639 Elkins Ln
- 633 Elkins Ln
- 648 Mountain View St
- 622 Mountain View St
- 627 Elkins Ln
- 635 Mountain View St
- 621 Elkins Ln
- 614 Mountain View St
- 629 Mountain View St
- 641 Elkins Ln
- 645 Mountain View St
- 625 Mountain View St
- 662 Mountain View St
- 649 Mountain View St
- 615 Elkins Ln
- 621 Mountain View St
- 608 Mountain View St
- 655 Mountain View St
Your Personal Tour Guide
Ask me questions while you tour the home.