634 Orchard Dr Redlands, CA 92374
South Redlands NeighborhoodEstimated Value: $553,000 - $698,000
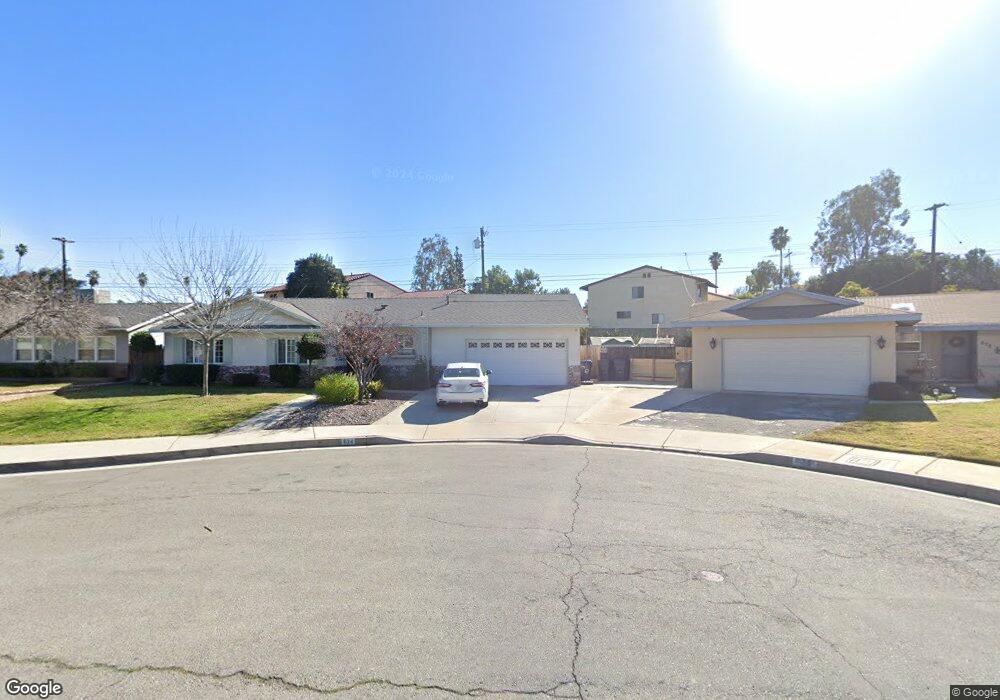
About This Home
This home is located at 634 Orchard Dr, Redlands, CA 92374 and is currently estimated at $624,827, approximately $399 per square foot. 634 Orchard Dr is a home located in San Bernardino County with nearby schools including Kingsbury Elementary School, Moore Middle School, and Redlands Senior High School.
Ownership History
We collect this data history from publicly available records. To have your information removed, we recommend requesting removal directly through your county’s website.
Purchase Details
Home Values in the Area
Average Home Value in this Area
Purchase History
We collect this data history from publicly available records. To have your information removed, we recommend requesting removal directly through your county’s website.
| Date | Buyer | Sale Price | Title Company |
|---|---|---|---|
| $91,500 | Lawyers Title Company |
Mortgage History
We collect this data history from publicly available records. To have your information removed, we recommend requesting removal directly through your county’s website.
| Date | Status | Borrower | Loan Amount |
|---|---|---|---|
| Open | $137,000 | ||
| Closed | $159,500 | ||
| Closed | $113,500 | ||
| Closed | $77,900 |
Tax History
We collect this data history from publicly available records. To have your information removed, we recommend requesting removal directly through your county’s website.
| Year | Tax Paid | Tax Assessment Tax Assessment Total Assessment is a certain percentage of the fair market value that is determined by local assessors to be the total taxable value of land and additions on the property. | Land | Improvement |
|---|---|---|---|---|
| 2026 | $2,332 | $188,926 | $57,003 | $131,923 |
| 2025 | $2,332 | $185,221 | $55,885 | $129,336 |
| 2024 | $2,179 | $181,589 | $54,789 | $126,800 |
| 2023 | $2,176 | $178,029 | $53,715 | $124,314 |
| 2022 | $2,145 | $174,538 | $52,662 | $121,876 |
| 2021 | $2,184 | $171,115 | $51,629 | $119,486 |
| 2020 | $2,152 | $169,361 | $51,100 | $118,261 |
| 2019 | $2,092 | $166,040 | $50,098 | $115,942 |
| 2018 | $2,041 | $162,785 | $49,116 | $113,669 |
| 2017 | $2,024 | $159,593 | $48,153 | $111,440 |
| 2016 | $2,001 | $156,464 | $47,209 | $109,255 |
| 2015 | $1,987 | $154,114 | $46,500 | $107,614 |
| 2014 | $1,951 | $151,095 | $45,589 | $105,506 |
Map
- 607 E Palm Ave
- 211 Orchid Ct
- 246 E Fern Ave
- 246 E Fern Ave Unit 205
- 803 E Palm Ave
- 242 E Fern Ave Unit 205
- 139 E Cypress Ave
- 254 E Fern Ave Unit 212
- 254 E Fern Ave Unit 107
- 618 Cypress Cir
- 1032 Ardmore Cir
- 18 W Cypress Ave
- 1010 Cimarron Ct
- 1132 E Citrus Ave
- 204 11th St
- 0 Campbell Ave
- 211 E Olive Ave
- 924 Alvarado St
- 352 Campbell Ave
- 235 Pinewood Ct
- 636 Orchard Dr
- 632 Orchard Dr
- 643 E Palm Ave
- 641 E Palm Ave
- 645 E Palm Ave
- 647 E Palm Ave
- 638 Orchard Dr
- 630 Orchard Dr
- 639 E Palm Ave
- 649 E Palm Ave
- 626 Orchard Dr
- 624 Orchard Dr
- 637 E Palm Ave
- 628 Orchard Dr
- 24774 E Redlands Blvd
- 622 Orchard Dr
- 633 E Palm Ave
- 629 E Palm Ave
- 631 E Palm Ave
- 627 E Palm Ave
Ask me questions while you tour the home.