Estimated Value: $306,427 - $364,000
3
Beds
2
Baths
2,080
Sq Ft
$161/Sq Ft
Est. Value
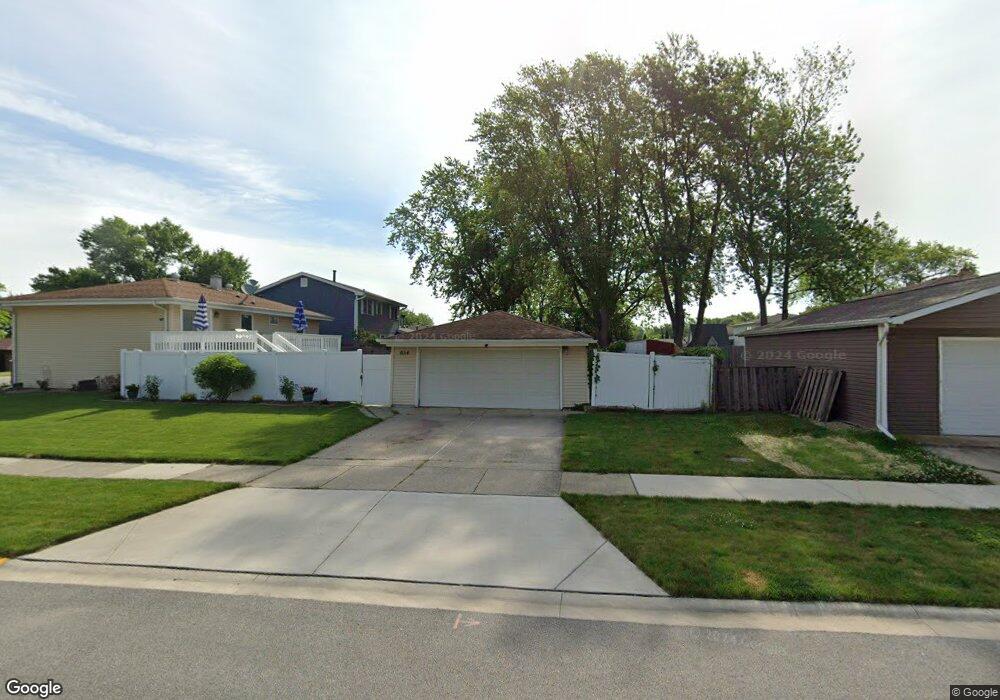
About This Home
This home is located at 634 Osage Dr, Dyer, IN 46311 and is currently estimated at $334,107, approximately $160 per square foot. 634 Osage Dr is a home located in Lake County with nearby schools including George Bibich Elementary School, Kahler Middle School, and Lake Central High School.
Ownership History
Date
Name
Owned For
Owner Type
Purchase Details
Closed on
Feb 18, 2016
Sold by
Lencioni Amanda
Bought by
Gibson Robert B
Current Estimated Value
Home Financials for this Owner
Home Financials are based on the most recent Mortgage that was taken out on this home.
Original Mortgage
$174,755
Outstanding Balance
$138,400
Interest Rate
3.75%
Mortgage Type
FHA
Estimated Equity
$195,707
Purchase Details
Closed on
Feb 3, 2009
Sold by
Lencioni David
Bought by
Lencioni Amanda
Create a Home Valuation Report for This Property
The Home Valuation Report is an in-depth analysis detailing your home's value as well as a comparison with similar homes in the area
Home Values in the Area
Average Home Value in this Area
Purchase History
| Date | Buyer | Sale Price | Title Company |
|---|---|---|---|
| Gibson Robert B | -- | Fidelity National Title Co | |
| Lencioni Amanda | -- | None Available |
Source: Public Records
Mortgage History
| Date | Status | Borrower | Loan Amount |
|---|---|---|---|
| Open | Gibson Robert B | $174,755 |
Source: Public Records
Tax History Compared to Growth
Tax History
| Year | Tax Paid | Tax Assessment Tax Assessment Total Assessment is a certain percentage of the fair market value that is determined by local assessors to be the total taxable value of land and additions on the property. | Land | Improvement |
|---|---|---|---|---|
| 2024 | $5,836 | $231,100 | $54,400 | $176,700 |
| 2023 | $2,632 | $229,500 | $54,400 | $175,100 |
| 2022 | $2,632 | $227,000 | $54,400 | $172,600 |
| 2021 | $2,251 | $204,700 | $48,300 | $156,400 |
| 2020 | $2,183 | $195,400 | $48,300 | $147,100 |
| 2019 | $2,098 | $183,400 | $31,600 | $151,800 |
| 2018 | $2,088 | $187,800 | $31,600 | $156,200 |
| 2017 | $1,872 | $182,600 | $31,600 | $151,000 |
| 2016 | $1,885 | $176,900 | $31,600 | $145,300 |
| 2014 | $1,834 | $181,400 | $31,600 | $149,800 |
| 2013 | $1,862 | $181,400 | $31,600 | $149,800 |
Source: Public Records
Map
Nearby Homes
- 11015 Delta Dr
- 2523 James Dr
- 736 Cottonwood Dr
- 2325 Hickory Dr
- 408 Cherry Hill Rd
- 2264 Sandcastle Dr
- 2265 Sandcastle Dr
- 2308 Flint Ct
- 924 Quinn Place
- 2316 Boulder Rd
- 2428 Rolling Hill Dr
- 2624 Fossil Stone Rd
- 2740 Hillcrest Dr Unit 46
- 505 Brittany Ln
- 14205 Jay St
- 14211 Jay St
- 101 Ridgewood Ln
- 14207 Jay St
- 2446 Forest Park Dr
- 1030 Rockwell Ln