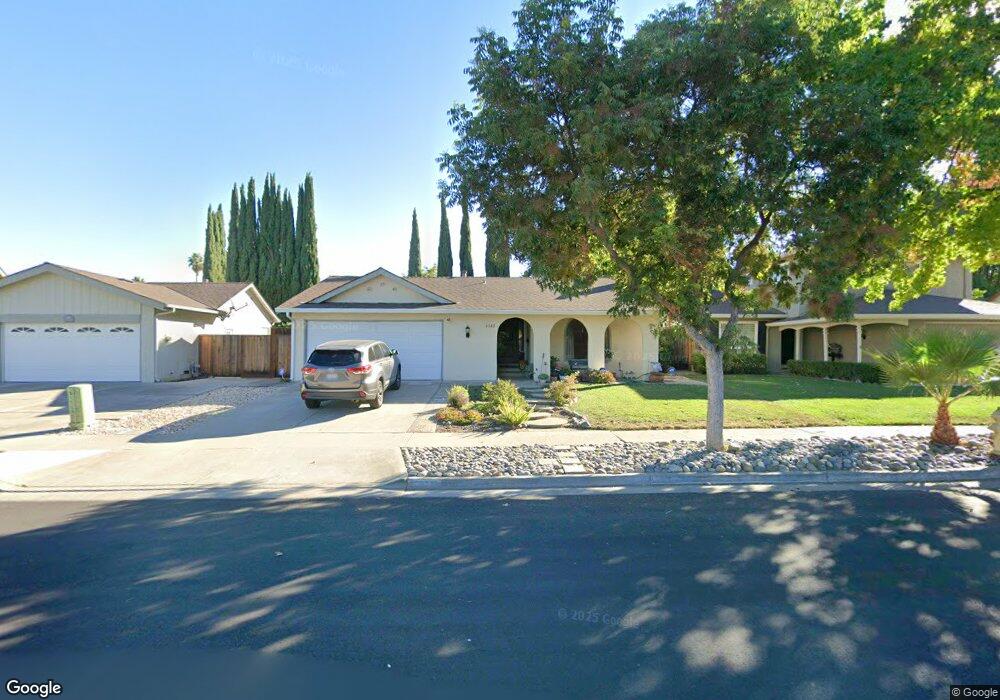
6342 Woosley Dr San Jose, CA 95123
Santa Teresa Foothills NeighborhoodEstimated Value: $1,425,000 - $1,568,000
4
Beds
2
Baths
1,475
Sq Ft
$1,001/Sq Ft
Est. Value
About This Home
This home is located at 6342 Woosley Dr, San Jose, CA 95123 and is currently estimated at $1,477,165, approximately $1,001 per square foot. 6342 Woosley Dr is a home located in Santa Clara County with nearby schools including Bertha Taylor Elementary School, Bernal Intermediate School, and Santa Teresa High School.
Ownership History
Date
Name
Owned For
Owner Type
Purchase Details
Closed on
Sep 21, 2011
Sold by
Verzosa Patricia A
Bought by
Verzosa Patricia A
Current Estimated Value
Home Financials for this Owner
Home Financials are based on the most recent Mortgage that was taken out on this home.
Original Mortgage
$138,000
Outstanding Balance
$53,729
Interest Rate
4.09%
Mortgage Type
New Conventional
Estimated Equity
$1,423,436
Purchase Details
Closed on
May 19, 2003
Sold by
Minato Alan K and Minato Lynn P
Bought by
Verzosa Anthony J and Verzosa Patricia A
Home Financials for this Owner
Home Financials are based on the most recent Mortgage that was taken out on this home.
Original Mortgage
$155,000
Interest Rate
5.75%
Mortgage Type
Purchase Money Mortgage
Purchase Details
Closed on
Sep 26, 1997
Sold by
Minato Dennis and Minato Tina
Bought by
Minato Dennis and Minato Augustina
Create a Home Valuation Report for This Property
The Home Valuation Report is an in-depth analysis detailing your home's value as well as a comparison with similar homes in the area
Home Values in the Area
Average Home Value in this Area
Purchase History
| Date | Buyer | Sale Price | Title Company |
|---|---|---|---|
| Verzosa Patricia A | -- | North American Title Co Inc | |
| Verzosa Anthony J | $455,000 | Chicago Title | |
| Minato Dennis | -- | -- |
Source: Public Records
Mortgage History
| Date | Status | Borrower | Loan Amount |
|---|---|---|---|
| Open | Verzosa Patricia A | $138,000 | |
| Closed | Verzosa Anthony J | $155,000 |
Source: Public Records
Tax History Compared to Growth
Tax History
| Year | Tax Paid | Tax Assessment Tax Assessment Total Assessment is a certain percentage of the fair market value that is determined by local assessors to be the total taxable value of land and additions on the property. | Land | Improvement |
|---|---|---|---|---|
| 2025 | $9,493 | $658,973 | $296,464 | $362,509 |
| 2024 | $9,493 | $646,052 | $290,651 | $355,401 |
| 2023 | $9,335 | $633,385 | $284,952 | $348,433 |
| 2022 | $9,277 | $620,966 | $279,365 | $341,601 |
| 2021 | $9,126 | $608,791 | $273,888 | $334,903 |
| 2020 | $8,916 | $602,549 | $271,080 | $331,469 |
| 2019 | $8,704 | $590,735 | $265,765 | $324,970 |
| 2018 | $8,431 | $579,153 | $260,554 | $318,599 |
| 2017 | $8,520 | $567,798 | $255,446 | $312,352 |
| 2016 | $8,107 | $556,666 | $250,438 | $306,228 |
| 2015 | $7,922 | $548,306 | $246,677 | $301,629 |
| 2014 | $7,217 | $537,566 | $241,845 | $295,721 |
Source: Public Records
Map
Nearby Homes
- 6415 Bevil Ct
- 6441 Cottle Rd
- 6273 Mountford Dr
- 377 Brookmere Dr
- 6449 Curie Ct
- 6362 San Anselmo Way
- 6468 Du Sault Dr
- 406 Madison Dr
- 497 Curie Dr
- 471 Tovar Dr
- 273 Jaggers Dr
- 6588 Korhummel Way
- 246 Castillon Way
- 6117 Yeadon Way
- 401 Henderson Dr
- 6239 Mahan Dr
- 6136 Dunn Ave
- 6579 Prague Ct
- 6165 Lavendula Way
- 6225 Barb Werner Ln