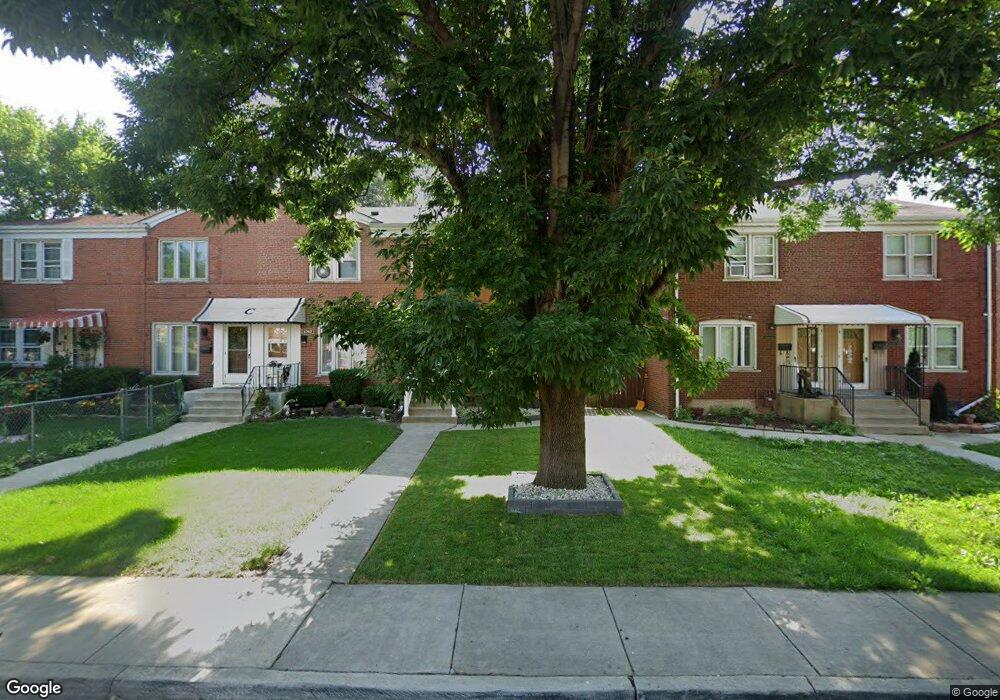
6347 S Lorel Ave Chicago, IL 60638
Clearing NeighborhoodEstimated Value: $206,000 - $238,000
2
Beds
1
Bath
912
Sq Ft
$246/Sq Ft
Est. Value
About This Home
This home is located at 6347 S Lorel Ave, Chicago, IL 60638 and is currently estimated at $224,477, approximately $246 per square foot. 6347 S Lorel Ave is a home located in Cook County with nearby schools including Grimes Elementary School, Kennedy High School, and St. Symphorosa Catholic School.
Ownership History
Date
Name
Owned For
Owner Type
Purchase Details
Closed on
Apr 26, 2005
Sold by
Chavez Maria
Bought by
Alba Edgar
Current Estimated Value
Home Financials for this Owner
Home Financials are based on the most recent Mortgage that was taken out on this home.
Original Mortgage
$124,000
Outstanding Balance
$89,548
Interest Rate
5%
Mortgage Type
Unknown
Estimated Equity
$134,929
Purchase Details
Closed on
Feb 15, 2002
Sold by
Chavez Ramon
Bought by
Chavez Maria
Home Financials for this Owner
Home Financials are based on the most recent Mortgage that was taken out on this home.
Original Mortgage
$95,000
Interest Rate
7.24%
Purchase Details
Closed on
Dec 1, 2000
Sold by
Stover Carmella A and Fauber Carmella A
Bought by
Chavez Ramon
Home Financials for this Owner
Home Financials are based on the most recent Mortgage that was taken out on this home.
Original Mortgage
$90,250
Interest Rate
6.91%
Create a Home Valuation Report for This Property
The Home Valuation Report is an in-depth analysis detailing your home's value as well as a comparison with similar homes in the area
Home Values in the Area
Average Home Value in this Area
Purchase History
| Date | Buyer | Sale Price | Title Company |
|---|---|---|---|
| Alba Edgar | $155,000 | Multiple | |
| Chavez Maria | $110,000 | Stewart Title | |
| Chavez Ramon | $95,000 | -- |
Source: Public Records
Mortgage History
| Date | Status | Borrower | Loan Amount |
|---|---|---|---|
| Open | Alba Edgar | $124,000 | |
| Previous Owner | Chavez Maria | $95,000 | |
| Previous Owner | Chavez Ramon | $90,250 | |
| Closed | Alba Edgar | $15,500 |
Source: Public Records
Tax History Compared to Growth
Tax History
| Year | Tax Paid | Tax Assessment Tax Assessment Total Assessment is a certain percentage of the fair market value that is determined by local assessors to be the total taxable value of land and additions on the property. | Land | Improvement |
|---|---|---|---|---|
| 2024 | $2,266 | $24,400 | $3,850 | $20,550 |
| 2023 | $2,188 | $16,401 | $3,438 | $12,963 |
| 2022 | $2,188 | $14,001 | $3,438 | $10,563 |
| 2021 | $2,145 | $13,999 | $3,437 | $10,562 |
| 2020 | $1,582 | $10,156 | $2,750 | $7,406 |
| 2019 | $1,588 | $11,285 | $2,750 | $8,535 |
| 2018 | $1,561 | $11,285 | $2,750 | $8,535 |
| 2017 | $1,996 | $12,587 | $2,475 | $10,112 |
| 2016 | $2,034 | $12,587 | $2,475 | $10,112 |
| 2015 | $1,839 | $12,587 | $2,475 | $10,112 |
| 2014 | $1,645 | $11,365 | $2,337 | $9,028 |
| 2013 | $1,602 | $11,365 | $2,337 | $9,028 |
Source: Public Records
Map
Nearby Homes
- 6403 S Lorel Ave
- 5533 W 63rd Place
- 6411 S Leclaire Ave
- 6415 S Leclaire Ave
- 5631 W 64th Place
- 6129 S Parkside Ave
- 6323 S Lamon Ave
- 5749 W 64th Place
- 6025 S Major Ave
- 6058 S Massasoit Ave
- 5817 W 64th St
- 6005 S Menard Ave
- 6403 S Kilpatrick Ave
- 6206 S Knox Ave
- 6559 S Kilpatrick Ave
- 6016 S Mayfield Ave
- 6037 S Mason Ave
- 5814 S Massasoit Ave
- 6710 S Keating Ave Unit 103
- 6152 S Austin Ave
- 6349 S Lorel Ave
- 6345 S Lorel Ave
- 6351 S Lorel Ave
- 6343 S Lorel Ave
- 6341 S Lorel Ave
- 6353 S Lorel Ave
- 6339 S Lorel Ave
- 6355 S Lorel Ave
- 6337 S Lorel Ave
- 6337 S Lorel Ave Unit 1
- 6335 S Lorel Ave
- 6348 S Lockwood Ave
- 6352 S Lockwood Ave
- 6333 S Lorel Ave
- 6350 S Lockwood Ave
- 6354 S Lockwood Ave
- 6358 S Lockwood Ave
- 6346 S Lockwood Ave
- 6356 S Lockwood Ave
- 6344 S Lockwood Ave