Estimated Value: $166,000 - $197,000
Studio
1
Bath
1,332
Sq Ft
$136/Sq Ft
Est. Value
About This Home
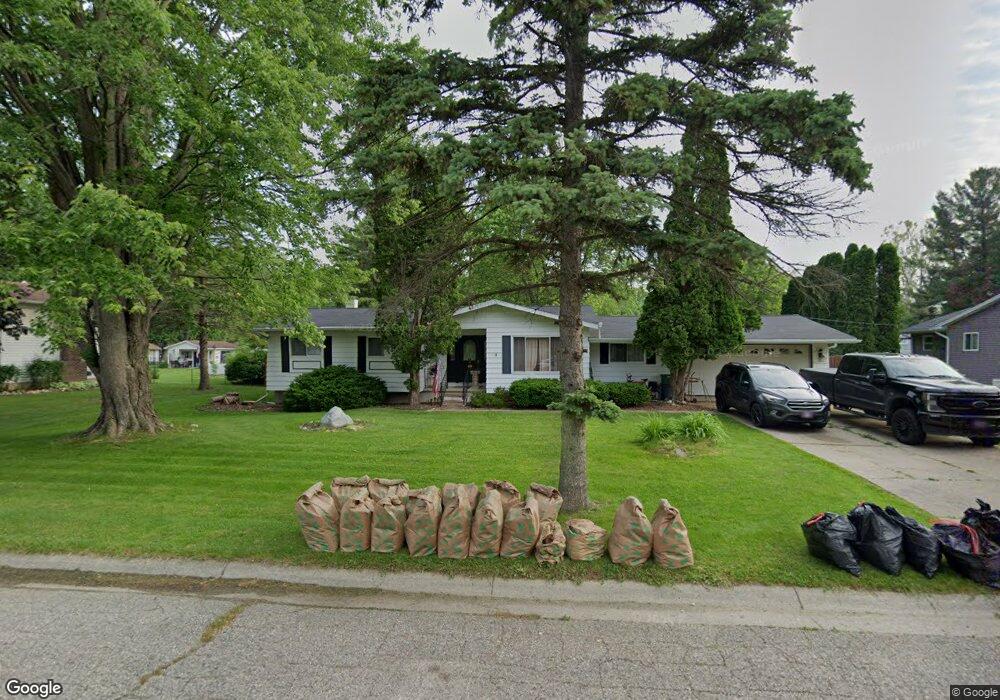
This home is located at 6349 Tamara Dr, Flint, MI 48506 and is currently estimated at $181,698, approximately $136 per square foot. 6349 Tamara Dr is a home located in Genesee County with nearby schools including Weston Elementary School, Leota Fiedler Elementary School, and Kate Dowdall Elementary School.
Ownership History
Date
Name
Owned For
Owner Type
Purchase Details
Closed on
Oct 30, 2024
Sold by
Mcmurray Theodore A and Mcmurray Jeanette
Bought by
Alexander Nickolas and Alexander Lisa
Current Estimated Value
Home Financials for this Owner
Home Financials are based on the most recent Mortgage that was taken out on this home.
Original Mortgage
$52,040
Outstanding Balance
$51,465
Interest Rate
6.09%
Mortgage Type
FHA
Estimated Equity
$130,233
Purchase Details
Closed on
Sep 6, 2013
Sold by
Petrella Clinton B and Petrella Kathleen L
Bought by
Mcmurray Theodore A and Mcmurray Jeanette
Home Financials for this Owner
Home Financials are based on the most recent Mortgage that was taken out on this home.
Original Mortgage
$66,748
Interest Rate
4.5%
Mortgage Type
FHA
Purchase Details
Closed on
Jan 15, 2010
Sold by
Petrella Harman L and Petrella Dessie I
Bought by
Petrella Harman L and Petrella Dessie I
Create a Home Valuation Report for This Property
The Home Valuation Report is an in-depth analysis detailing your home's value as well as a comparison with similar homes in the area
Home Values in the Area
Average Home Value in this Area
Purchase History
| Date | Buyer | Sale Price | Title Company |
|---|---|---|---|
| Alexander Nickolas | $53,000 | None Listed On Document | |
| Alexander Nickolas | $53,000 | None Listed On Document | |
| Mcmurray Theodore A | $68,000 | Title Source Inc | |
| Petrella Harman L | -- | None Available |
Source: Public Records
Mortgage History
| Date | Status | Borrower | Loan Amount |
|---|---|---|---|
| Open | Alexander Nickolas | $52,040 | |
| Closed | Alexander Nickolas | $52,040 | |
| Previous Owner | Mcmurray Theodore A | $66,748 |
Source: Public Records
Tax History
| Year | Tax Paid | Tax Assessment Tax Assessment Total Assessment is a certain percentage of the fair market value that is determined by local assessors to be the total taxable value of land and additions on the property. | Land | Improvement |
|---|---|---|---|---|
| 2025 | $1,905 | $82,200 | $0 | $0 |
| 2024 | $503 | $75,700 | $0 | $0 |
| 2023 | $480 | $67,700 | $0 | $0 |
| 2022 | $1,674 | $63,600 | $0 | $0 |
| 2021 | $1,660 | $57,600 | $0 | $0 |
| 2020 | $439 | $52,900 | $0 | $0 |
| 2019 | $432 | $46,800 | $0 | $0 |
| 2018 | $1,933 | $42,700 | $0 | $0 |
| 2017 | $1,405 | $41,200 | $0 | $0 |
| 2016 | $1,515 | $39,700 | $0 | $0 |
| 2015 | $1,193 | $37,500 | $0 | $0 |
| 2014 | $398 | $34,600 | $0 | $0 |
| 2012 | -- | $29,300 | $29,300 | $0 |
Source: Public Records
Map
Nearby Homes
- 6363 Bluejay Dr
- 6161 Finch Ln
- 3485 N Vassar Rd
- 4062 N Belsay Rd
- 6443 Richfield Rd
- 6054 E Pierson Rd
- 3365 Eastdale Dr
- 5165 N Irish Rd
- 5177 N Irish Rd
- 1240 N Irish Rd
- 3296 Mills Acres St
- 5067 Paro Dr
- 3179 Gehring Dr
- 3148 Gehring Dr
- 3267 Mills Acres St
- 4455 N Genesee Rd
- 4452 Muriel Dr
- 0 Whisper Ridge Ct
- 4489 Home Town Dr Unit 32
- 4465 Market Place
- 6359 Tamara Dr
- 6339 Tamara Dr
- 6348 Bluejay Dr
- 6358 Bluejay Dr
- 6338 Bluejay Dr
- 6327 Tamara Dr
- 6369 Tamara Dr
- 6350 Tamara Dr
- 6342 Tamara Dr
- 6360 Tamara Dr
- 6368 Bluejay Dr
- 6324 Bluejay Dr
- 6330 Tamara Dr
- 6370 Tamara Dr
- 6317 Tamara Dr
- 4339 Bobwhite Dr
- 6312 Bluejay Dr
- 4349 Bobwhite Dr
- 6320 Tamara Dr
- 4323 Bobwhite Dr
Your Personal Tour Guide
Ask me questions while you tour the home.